Join Our Telegram channel to stay up to date on breaking news coverage
The Bitcoin price prediction is currently moving bearishly and seems to be preparing for the next move below the support level of $21,800.
Bitcoin Prediction Statistics Data:
- Bitcoin price now – $22,154
- Bitcoin market cap – $425.2 billion
- Bitcoin circulating supply – 19.2 million
- Bitcoin total supply – 19.2 million
- Bitcoin Coinmarketcap ranking – #1
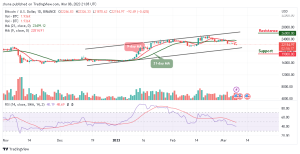
BTC/USD Long-term Trend: Ranging (Daily Chart)
Key levels:
Resistance Levels: $26,000, $28,000, $30,000
Support Levels: $19,000, $17,000, $15,000
BTC/USD is seen hovering at $22,154, with the current consolidation pattern, the king coin remains below the 9-day and 21-day moving averages. Though Bitcoin (BTC) begins the day off intending to trend higher but couldn’t. Meanwhile, any bullish cross above the 9-day and 21-day moving averages could hit the nearest resistance level of $24,000. Meanwhile, any bearish cross below the lower boundary of the channel could locate the first level of support at $20,000. Beneath this, other supports could below found at $19,000, $17,000, and $15,000.
Bitcoin Price Prediction: Bitcoin (BTC) May Face the Downside
The Bitcoin price is sliding toward the lower boundary of the channel as the technical indicator Relative Strength Index (14) moves to cross below the 40-level. On the next positive move, BTC could break to the upside as the candle is still yet to close. Meanwhile, if the bulls push the king coin to the north, the potential resistance levels could be found at $26,000, $28,000, and $30,000.
BTC/USD Medium-term Trend: Bearish (4H Chart)
On the 4-hour chart, BTC/USD may need to cross above the 9-day and 21-day moving averages, and move toward the upper boundary of the channel to mitigate the short-term bearish pressure so that it can hit the nearest resistance level of $23,000. Nonetheless, this psychological barrier may be closely followed by the resistance level of $23,500 and above.
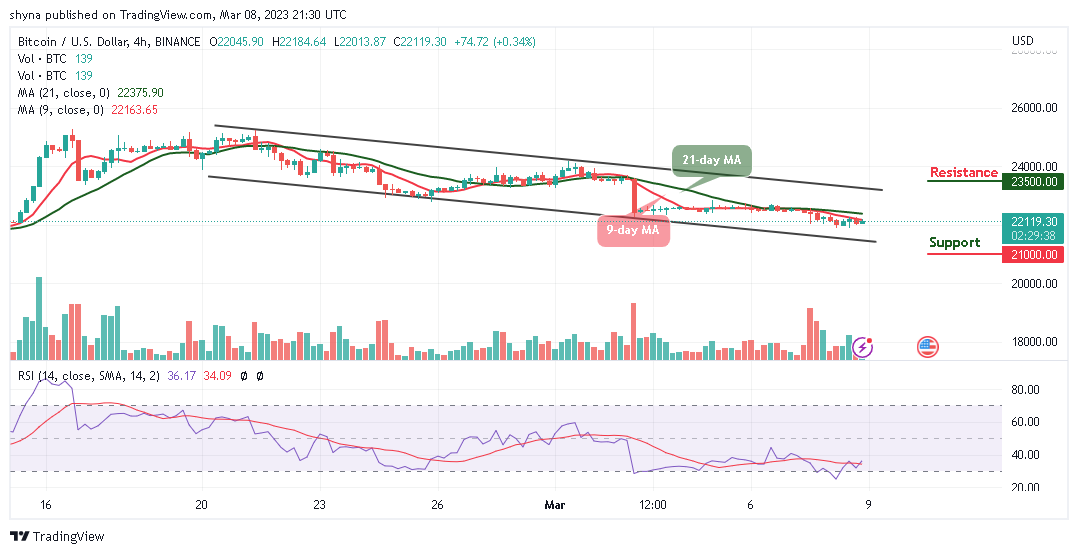
On the contrary, if the king coin heads to the downside, the nearest support may come at $21,500 and a sustainable bearish movement could increase the downside pressure and bring the price toward $21,000 and below. Considering the technical indicator Relative Strength Index (14) on the 4-hour chart, the coin is starting to move to the upside as traders might expect a bullish movement.
Bitcoin Alternatives
The Bitcoin price is showing a sign of weakness across its markets as the first digital asset is down by 0.42%, reflecting a price drop in the market and the fall might become heavy if the bearish action continues. Therefore, since BTC/USD is moving bearishly, traders can expect the trend to keep advancing lower if the price action crosses below the support of $21,500. Nevertheless, the FightOut token keeps doing great in the presale as the token stays relevant because the market is experiencing significant growth. Meanwhile, FGHT has proven to be one of the most promising cryptos after effectively filling the gaps in the move-to-earn industry to provide a customer-centric approach as almost $5.5m has been made in the presale.
Join Our Telegram channel to stay up to date on breaking news coverage