Join Our Telegram channel to stay up to date on breaking news coverage
The Bitcoin price prediction gains 4.22% as bulls keep working hard to nurture a bullish trend above the upper boundary of the channel.
Bitcoin Prediction Statistics Data:
- Bitcoin price now – $26,176
- Bitcoin market cap – $503.7 billion
- Bitcoin circulating supply – 19.3 million
- Bitcoin total supply – 19.3 million
- Bitcoin Coinmarketcap ranking – #1
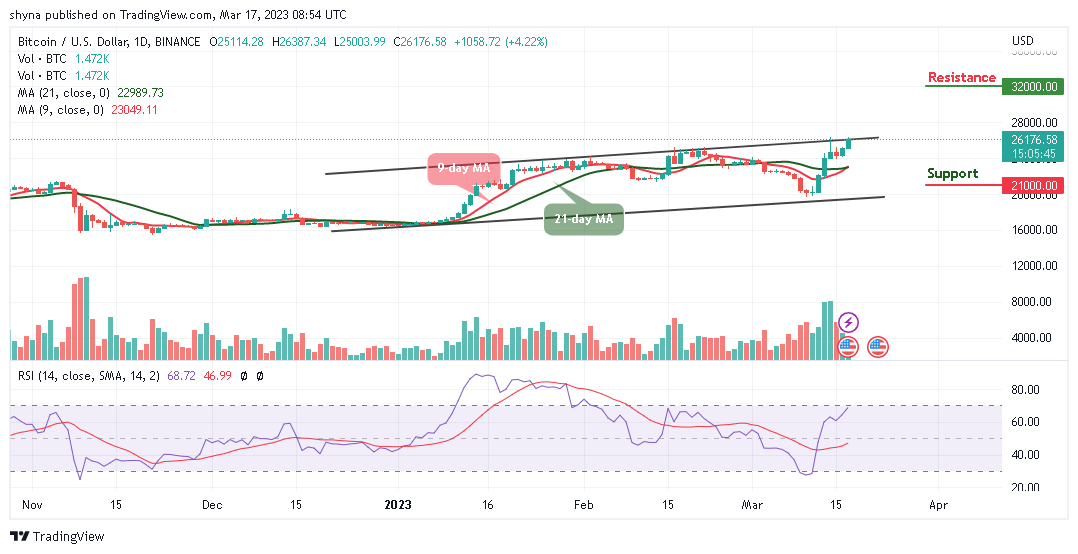
BTC/USD Long-term Trend: Bullish (Daily Chart)
Key levels:
Resistance Levels: $32,000, $34,000, $36,000
Support Levels: $21,000, $19,000, $17,000
BTC/USD is at the time of writing hovering at the $26,176 resistance level as the market price moves to cross above the upper boundary of the channel, indicating a bullish movement. For the past few days, the Bitcoin price has been moving towards the north, and with the look of things; the king coin is expected to hit the potential resistance level of $30k.
Bitcoin Price Prediction: Will BTC Break Above $28,000 Resistance?
Looking at the daily chart, the Bitcoin price is likely to cross above the upper boundary of the channel to continue the bullish movement. However, if the Bitcoin price can cross above this barrier, it could touch the nearest resistance at the $28,000 level. This is where traders should expect buyers to fight for a further rise in BTC/USD and further development of the bullish trend. However, the purpose of this movement is to provide a level of resistance close to $30,000.
Looking at the market movement, there is likely that the Bitcoin price may experience a quick retracement or sell-off just in case it touches the crucial support level at$25,500 level, but if not; traders may see additional resistance levels of $32,000, $34,000, and $36,000 respectively. On the downside, if the market decides to fall, BTC/USD could face the lower boundary of the channel, and if it crosses below the 9-day and 21-day moving averages, the Bitcoin price could see a further decline toward the support levels of $21,000, $19,000, and $17,000. As revealed by the technical indicator, the market may gain more if the Relative Strength Index (14) crosses into the overbought region.
BTC/USD Medium-term Trend: Bullish (4H Chart)
On the 4-hour chart, traders expect the coin to cross above the upper boundary of the channel. On the contrary, if the sellers step back into the market, it could hold the coin not to follow the upward movement, and the $23,000 and below may come into play.
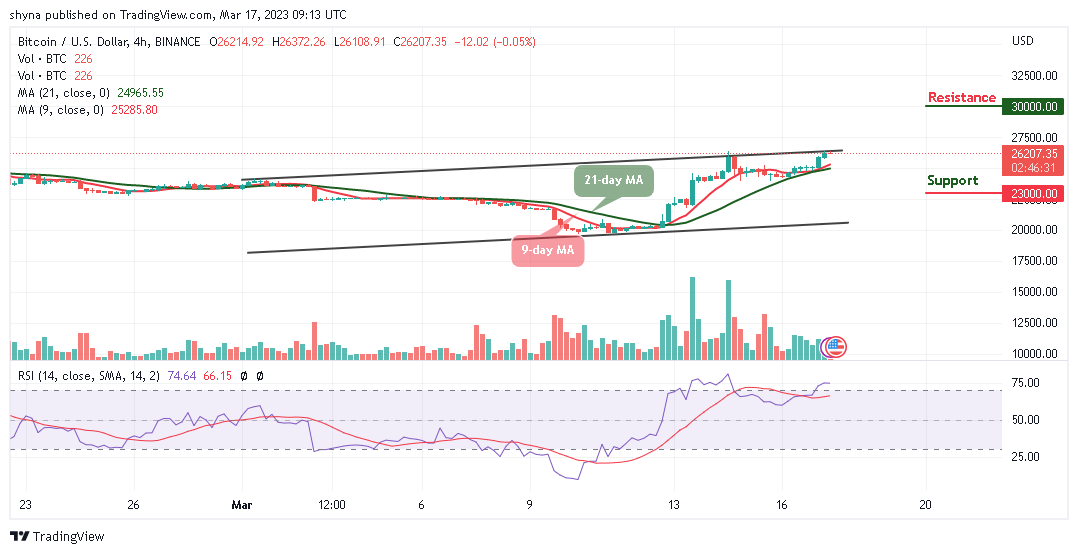
However, in as much as the buyers keep the price above the moving averages, traders may expect a strong bullish movement that could hit the resistance at $30,000 and above. Meanwhile, the technical indicator Relative Strength Index (14) is within the overbought region, suggesting that more bullish signals may play out.
Alternatives to Bitcoin
The Bitcoin price is hovering above the 9-day and 21-day moving averages. Therefore, if the king coin soars above the channel, this could be a sign of sustainability and could result in a bullish continuation. On that note, Love Hate Inu (LHINU) is another meme token that offers real utility in a blockchain-based voting system. However, it is a secure and transparent platform for voting on important issues. Therefore, you can bet to voting as an entry mechanism secured by smart contracts prevents spam and manipulation, so the voting process is both verifiable and anonymous as close to $1 has been raised so far.
Join Our Telegram channel to stay up to date on breaking news coverage