Join Our Telegram channel to stay up to date on breaking news coverage
The Bitcoin price prediction is currently consolidating as the king coin couldn’t hold above the resistance level of $23,500.
Bitcoin Prediction Statistics Data:
- Bitcoin price now – $22,696
- Bitcoin market cap – $434.0 billion
- Bitcoin circulating supply – 19.1 million
- Bitcoin total supply – 19.1 million
- Bitcoin Coinmarketcap ranking – #1
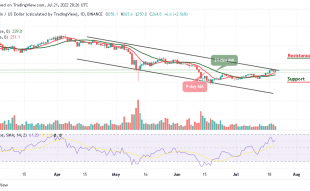
BTC/USD Long-term Trend: Ranging (Daily Chart)
Key levels:
Resistance Levels: $30,000, $32,000, $34,000
Support Levels: $18,000, $16,000, $14,000
BTC/USD couldn’t cross into the resistance level of $24,000 with the current consolidation pattern as it fails to move above the upper boundary of the channel. Bitcoin (BTC) begins the day by trending higher touching the daily high at $23,763 before falling lower to trade back near the 9-day moving average. Similarly, the first level of support is located at around $22,500. Beneath this, other supports could be found at $18,000, $16,000, and $14,000 respectively.
Bitcoin Price Prediction: Bitcoin (BTC) May Head to the South
The Bitcoin price is heading towards the 9-day and 21-day moving averages; however, this is looking less and less with each failed breakout attempt as the technical indicator Relative Strength Index (14) also heads toward the 50-level. From above, BTC is likely to break above the channel to reach the nearest resistance level of $25,000. Although the candle is still yet to close, it does look that the bulls may end up closing above the channel as the potential resistance levels could be found at $30,000, $32,000, and $34,000.
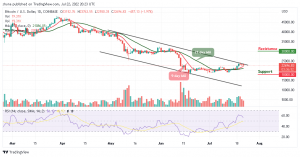
BTC/USD Medium-Term Trend: Bullish (4H Chart)
According to the 4-hour chart, BTC/USD may need to cross above $the moving averages and move towards the upper boundary of the channel to mitigate the short-term bearish pressure in other to hit the nearest resistance level of $24,000. However, any further bullish movement may be closely followed by the resistance level of $25,000 and above.
Meanwhile, the nearest support may come at $22,000 and a sustainable move below this level could hit the support level at $20,500 and below. Nevertheless, the technical indicator Relative Strength Index (14) is likely to cross above the 50-level, as traders may expect that the bullish movement may come to play.
Read more:
- How to buy Bitcoin
- How to buy Cryptocurrency
Join Our Telegram channel to stay up to date on breaking news coverage