Join Our Telegram channel to stay up to date on breaking news coverage
The Bitcoin price prediction is likely to retreat a little bit before reaching the potential resistance level of $25,000.
Bitcoin Prediction Statistics Data:
- Bitcoin price now – $22,437
- Bitcoin market cap – $429.3 billion
- Bitcoin circulating supply – 19.0 million
- Bitcoin total supply – 19.0 million
- Bitcoin Coinmarketcap ranking – #1
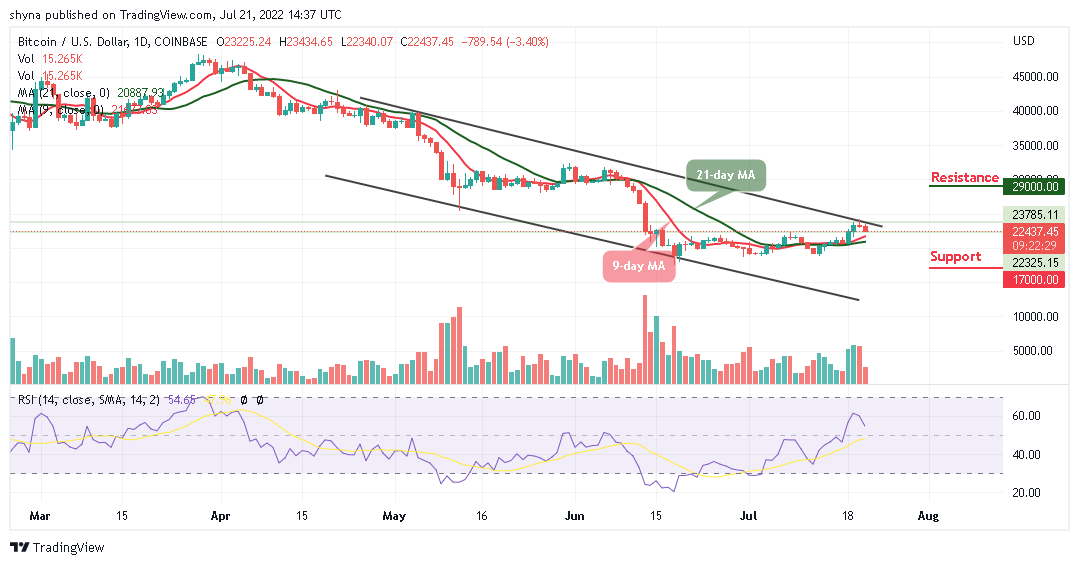
BTC/USD Long-term Trend: Ranging (Daily Chart)
Key levels:
Resistance Levels: $29,000, $31,000, $33,000
Support Levels: $17,000, $15,000, $13,000
BTC/USD fails to reach the resistance level of $24,000 as the largest cryptocurrency heads toward the 9-day and 21-day moving averages. However, the bearish movement seen across the crypto market shows that the cryptos are preparing for another bullish spike to the upside.
Bitcoin Price Prediction: Would BTC Price Go Lower?
The Bitcoin price is trading at $22,437 with an intraday loss of 3.40% as the prevailing trend is likely to follow the bearish movement. However, Bitcoin (BTC) is currently facing the south within the channel, and a continuous bearish movement could lower the price to the downside. In the meantime, BTC/USD is likely to fall and stay below the 9-day and 21-day moving averages which could hit the critical support levels at $17,000, $15,000, and $13,000.
However, if the Bitcoin price crosses above the upper boundary of the channel; the price could rise to $25,000 vital resistance while a further bullish drive could take the coin to the resistance levels of $29,000, $31,000, and $33,000 respectively. Moreover, the technical indicator Relative Strength Index (14) is sliding below the 60-level, which shows a possible bearish momentum within the channel.
BTC/USD Medium-Term Trend: Ranging (4H Chart)
As the market opens today, the Bitcoin price touches the daily low of $22,340, but now hovering around $22,551. Should the price drop and head towards the lower boundary of the channel, it could hit the next level of support at $20,000 and below.
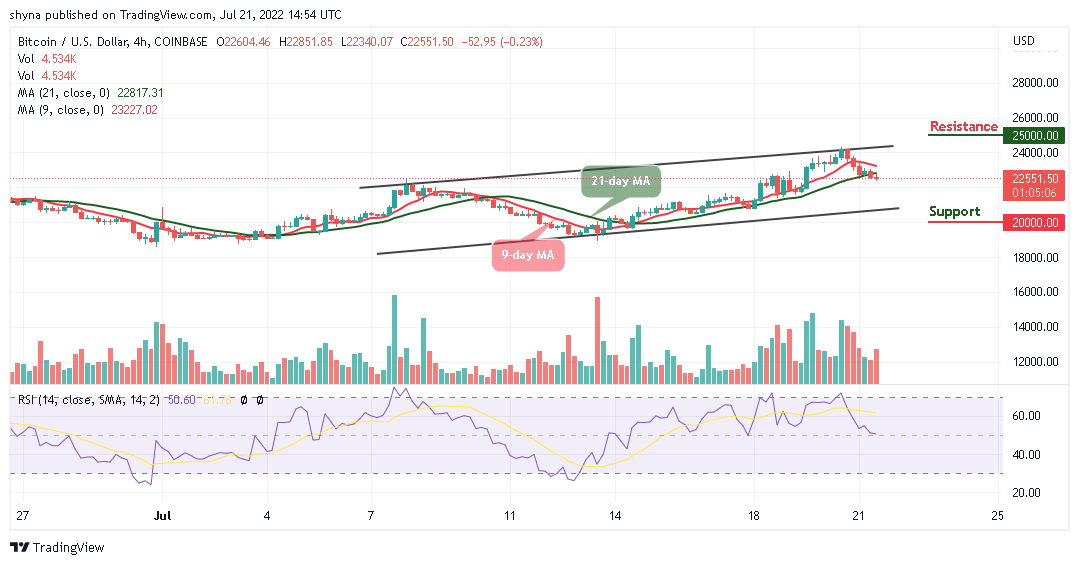
However, if the bulls push the coin above the 9-day and 21-day moving averages, the Bitcoin price could hit the potential resistance level of $25,000 and above. For now, the market may experience a downtrend if the technical indicator Relative Strength Index (14) crosses below the 40-level.
Read more:
- How to buy Bitcoin
- How to buy Cryptocurrency
Join Our Telegram channel to stay up to date on breaking news coverage