Join Our Telegram channel to stay up to date on breaking news coverage
The Bitcoin price prediction reveals that BTC may break out of the current short-term pattern and move towards the $22,000 level.
Bitcoin Prediction Statistics Data:
- Bitcoin price now – $20,800
- Bitcoin market cap – $397.2 billion
- Bitcoin circulating supply – 19.0 million
- Bitcoin total supply – 19.0 million
- Bitcoin Coinmarketcap ranking – #1
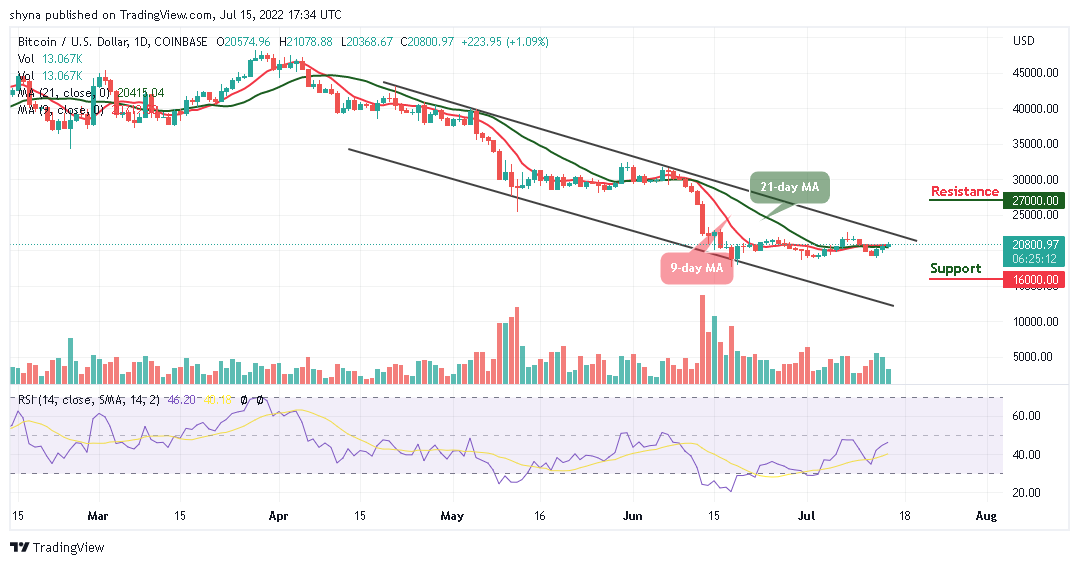
BTC/USD Long-term Trend: Bearish (Daily Chart)
Key levels:
Resistance Levels: $27,000, $29,000, $30,000
Support Levels: $16,000, $14,000, $12,000
BTC/USD is at the moment trading at $20,800 with a 1.09% gain since the beginning of today’s trading. Looking at the daily chart, the Bitcoin price may struggle to stay above the 9-day and 21-day moving averages, for BTC/USD to remain above this barrier, it could make many traders feel that the $20,000 support level could be pretty strong.
Bitcoin Price Prediction: Would BTC Price Break Higher
The Bitcoin price may not drop much because of today’s trading, but if the first digital coin breaks below the support level of $20,000, it could change the direction of the coin to face the lower boundary of the channel. Alternatively, Bitcoin (BTC) may reclaim the previous resistance level of $21,000 to head to the upside. If successful, BTC/USD could aim at the resistance levels of $27,000, $29,000, and $31,000 respectively.
Nevertheless, the technical indicator Relative Strength Index (14) remains below the 50-level as the coin may consolidate around this level. Moreover, this could mean that there may still be a room that could be explored by the bears if it crosses below 40-level. Therefore, the support levels of $16,000, $14,000, and $12,000 may play out.
BTC/USD Medium-Term Trend: Ranging (4H Chart)
From a technical point of view, the technical indicator Relative Strength Index (14) is recovering above the 60-level, and this will confirm the bullish movement if it heads toward the overbought region.
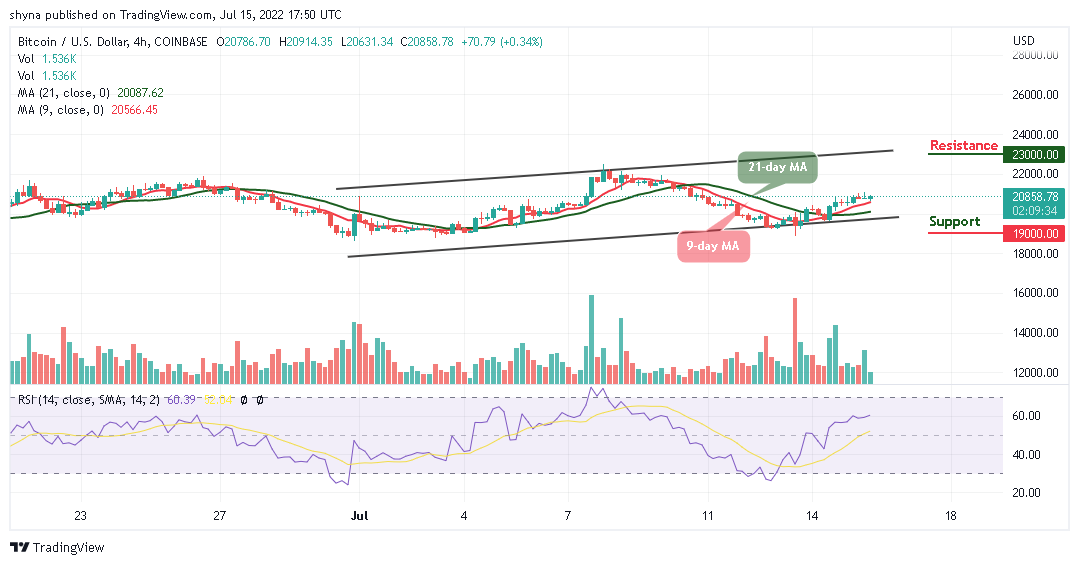
However, if the Bitcoin price breaks below the lower boundary of the channel, the market price may likely reach support at $19,000 and below. Meanwhile, if the current market value rises and increases the bullish movement, it may reach the resistance level at $23,000 and above.
Read more:
- How to buy Bitcoin
- How to buy Cryptocurrency
Join Our Telegram channel to stay up to date on breaking news coverage