
Join Our Telegram channel to stay up to date on breaking news coverage
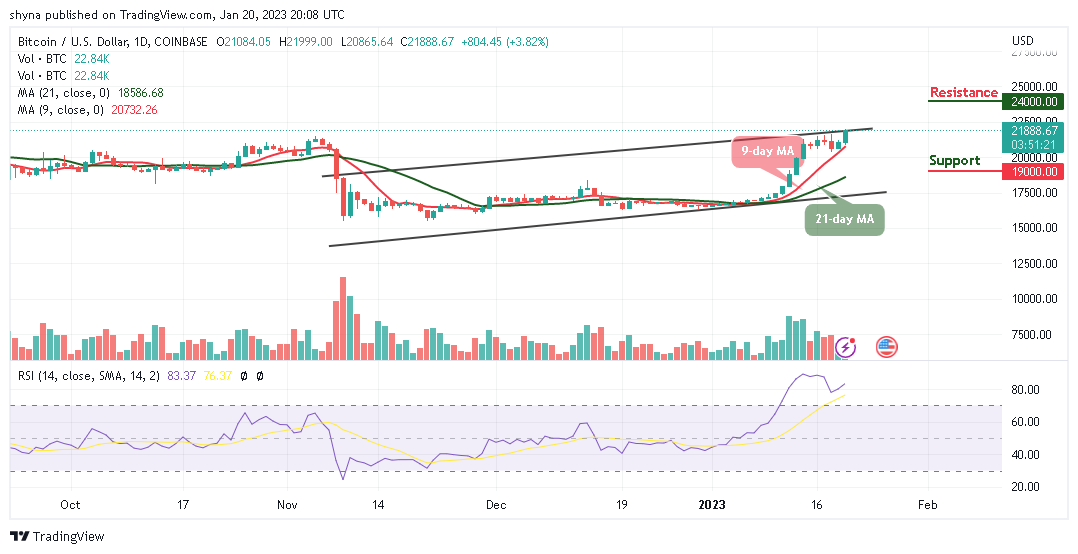
The Bitcoin price prediction restarts the uptrend after crossing above the potential barrier of $21,500 to touch the daily high of $21,999.
Bitcoin Prediction Statistics Data:
- Bitcoin price now – $21,888
- Bitcoin market cap – $421.7 billion
- Bitcoin circulating supply – 19.2 million
- Bitcoin total supply – 19.2 million
- Bitcoin Coinmarketcap ranking – #1
BTC/USD Long-term Trend: Bullish (Daily Chart)
Key levels:
Resistance Levels: $24,000, $25,000, $26,000
Support Levels: $19,000, $18,000, $17,000
BTC/USD looks green today as the price hovers above the resistance level of $21,500 from the low of $20,568. However, a daily close above the $22,000 level can increase the Bitcoin price to $23,000. At the moment, all eyes focus on the next hurdle above the upper boundary of the channel as a consistent price increase may encourage more buyers to join the market if bulls increase their positions.
Bitcoin Price Prediction: Bitcoin Price May Jump to the Upside
At the time of writing, the Bitcoin price is moving bullishly at its current price of $21,888.67 with two straight bullish days. According to the daily chart, this marks a meaningful climb from the opening price of $20,865 level; therefore, it is important to note that the current price movement may break above the upper boundary of the channel.
Nevertheless, if the market decides to fall below the 9-day and 21-day moving averages, the Bitcoin price could go toward the lower boundary of the channel, and before getting to this barrier, traders could have hit the support levels at $19,000, $18,000, and $17,000 respectively. All the same, any further bullish movement may push the coin to the resistance level of $24,000, $25,000, and $26,000 as the Relative Strength Index (14) stays within the overbought region, suggesting more bullish signals.
BTC/USD Medium-term Trend: Ranging (4H Chart)
According to the 4-hour chart, the Bitcoin price is hovering above the 9-day and 21-day moving averages as the intraday trading looks bullish facing the upper boundary of the channel to hit the resistance level of $24,000 and above.
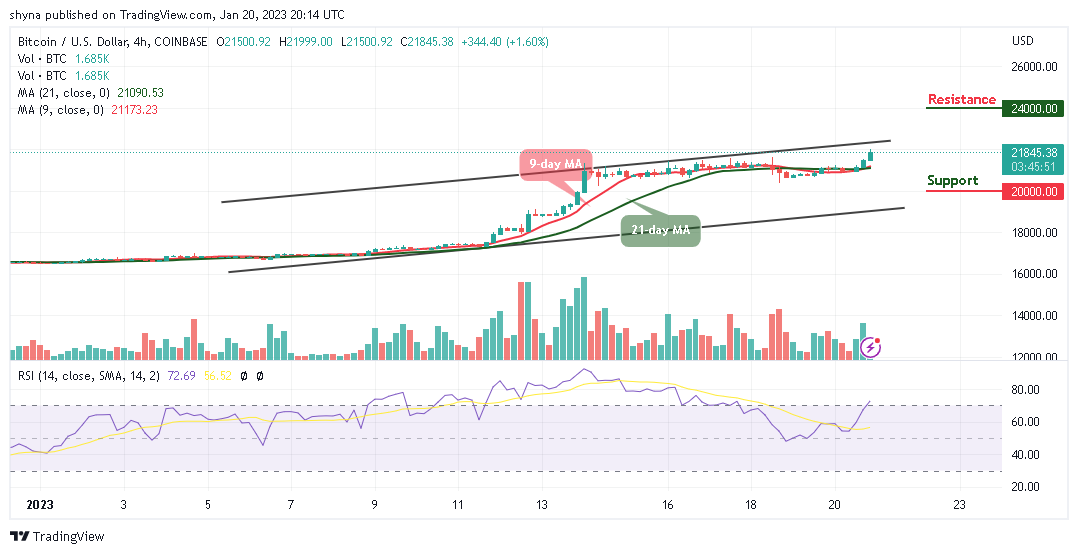
However, if the buyers failed to keep pushing the market upward, traders can expect a retreat below the support level of $21,000, and breaking below this level may further bring the price toward the lower boundary of the channel to reach the support level of $20,000 and below. Meanwhile, the Relative Strength Index (14) is crossing above the 70-level, suggesting bullish signals.
However, Meta Masters Guild (MEMAG) is the most rapidly growing Play-to-Earn guild of this year. Therefore, it is going to be the biggest mobile gaming guild in Web3. Fun and interesting games, which are compatible with NFTs, are created. And there, community members are rewarded as they speculate and also invest. The MEMAG presale is ongoing and close to $1 million has been raised so far.
Related
- Meta Masters Guild – The Fastest Growing Play-to-Earn Guild of 2023
- How to buy MEMAG
Join Our Telegram channel to stay up to date on breaking news coverage