Join Our Telegram channel to stay up to date on breaking news coverage
The Bitcoin price prediction shows that BTC is trading at $19,264 as the coin seems to be preparing for another upward movement.
Bitcoin Prediction Statistics Data:
- Bitcoin price now – $19,264
- Bitcoin market cap – $371.6 billion
- Bitcoin circulating supply – 19.2 million
- Bitcoin total supply – 19.2 million
- Bitcoin Coinmarketcap ranking – #1
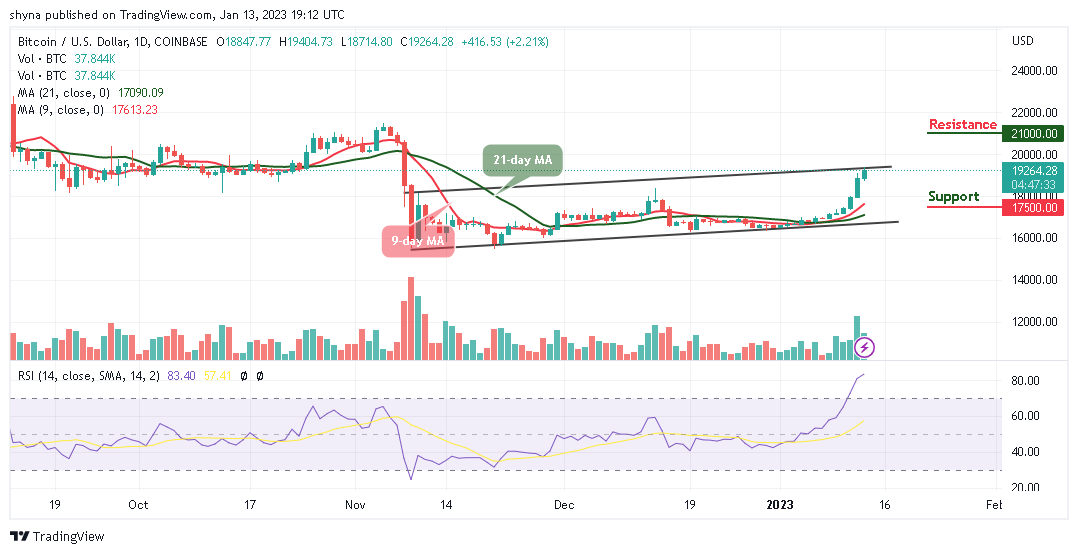
BTC/USD Long-term Trend: Ranging (Daily Chart)
Key levels:
Resistance Levels: $21,000, $23,000, $25,000
Support Levels: $17,500, $15,500, $13,500
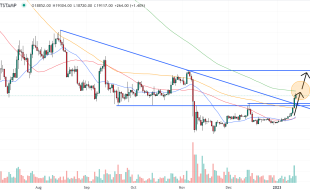
BTC/USD is likely to cross above the upper boundary of the channel at $19,129.72 as the coin prepares to follow the upward movement. At the time of writing, the king coin is likely to extend toward the resistance level of $20,000 if the bulls put in more effort.
Bitcoin Price Prediction: Bitcoin (BTC) May Hit $20k Resistance
The Bitcoin price is heading toward the upside, any further bullish movement above the channel could locate the potential resistance levels at $21,000, $23,000, and $25,000. Nevertheless, if BTC/USD soars to the upper boundary of the channel, this could be a sign of sustainability and may likely result in a bullish continuation.
However, if the Bitcoin price fails to move up; traders could see a price cut towards the lower boundary of the channel, and a further low could bring the price to the support levels at $17,500, $15,500, and $13,500 respectively. But as it stands, the Bitcoin price is likely to spike as the technical indicator Relative Strength Index (14) hovers within the overbought region.
BTC/USD Medium-term Trend: Bullish (4H Chart)
According to the 4-day chart, the Bitcoin price is hovering above the 9-day and 21-day moving averages. However, suppose the bulls push the market above this upper boundary of the channel, traders may expect a retest of the $19,400 resistance level, breaking this level may further push the price towards the resistance level of $20,000 and above as the technical indicator Relative Strength Index (14) remains within the overbought region, which is suggesting a bullish signal.
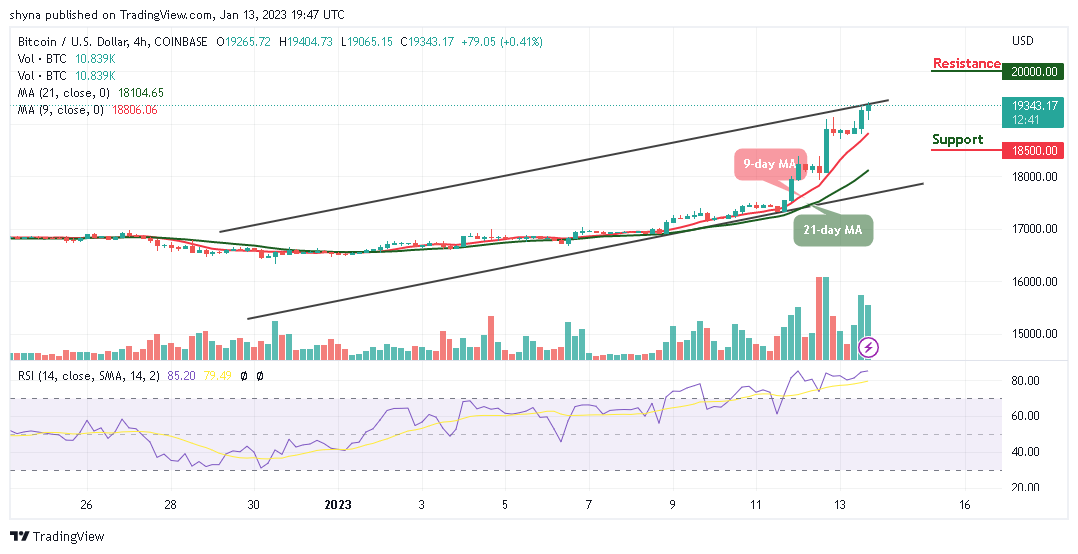
However, if the bulls failed to push the market above the channel, traders may expect a break below the 9-day moving average, and breaking below this barrier may further bring the price toward the critical support level of $18,500 and below.
Furthermore, Meta Masters Guild (MEMAG) is the most rapidly growing Play-to-Earn guild of this year. It is going to be the biggest mobile gaming guild in Web3. Fun and interesting games, which are compatible with NFTs, are created. And there, community members are rewarded as they speculate and also invest. The MEMAG presale is ongoing and close to $500,000 has been raised so far.
Related
- Meta Masters Guild – The Fastest Growing Play-to-Earn Guild of 2023
- How to buy MEMAG
Join Our Telegram channel to stay up to date on breaking news coverage