Join Our Telegram channel to stay up to date on breaking news coverage
The Bitcoin price prediction shows that BTC bounces off the support at $17,326 as the coin moves close to the resistance level of $17,500 within the channel.
Bitcoin Prediction Statistics Data:
- Bitcoin price now – $17,326
- Bitcoin market cap – $337.5 billion
- Bitcoin circulating supply – 19.2 million
- Bitcoin total supply – 19.2 million
- Bitcoin Coinmarketcap ranking – #1
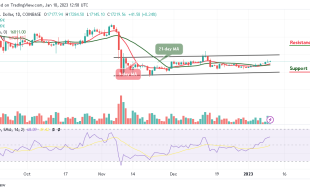
BTC/USD Long-term Trend: Ranging (Daily Chart)
Key levels:
Resistance Levels: $19,000, $21,000, $23,000
Support Levels: $16,000, $14,000, $12,000
BTC/USD is trading around $17,326 with a 0.67% loss as the coin touches the daily low at $17,326. According to the daily chart, the Bitcoin price may continue to fight to stay above the important resistance level of $17,000 as it could move near the upper boundary of the channel. However, for BTC/USD to remain above the 9-day and 21-day, the bulls need to make the $17,000 support level to be strong.
Bitcoin Price Prediction: Bitcoin (BTC) May Spike Higher
At the time of writing, the Bitcoin price is seen hovering above the 9-day and 21-day moving averages, and if it breaks above the upper boundary of the channel, BTC/USD could touch the nearest resistance level of $18,500. Moreover, the king coin needs to claim this important resistance level to head to the upside.
However, looking at the Relative Strength Index (14), the signal line is likely to cross into the overbought region, but the recovery may not come easy, and traders must be aware that support will have to be sort above $17,000 while other important levels could be located at $19,000, $21,000, and $22,000 resistance levels.
Meanwhile, despite the current movement, the Relative Strength Index (14) is likely to slide below the 60-level which means there may still be a room that could be explored by the bears. If this happens, the supports at $16,000, $14,000, and $12,000 may likely come to focus.
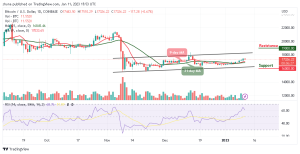
BTC/USD Medium-term Trend: Bullish (4H Chart)
On the 4-hour chart, the technical indicator Relative Strength Index (14) moves to cross below the 60-level and could head to the south to begin a downward movement. On the other hand, the chart reveals that there is a little bullish movement within the market as the technical indicator could face the upside.
However, if the Bitcoin price breaks above the upper boundary of the channel, it is likely for the king coin to hit the potential resistance at $17,800 and above. Meanwhile, if the current market value drops below the 9-day and 21-day moving averages, it may touch the support at $17,000 and below.
Nonetheless, Dash 2 Trade gives you the ability to optimize your trading and speculative profitability with effective crypto trading recommendations, auto trading, and analytics features. There is a D2T token presale ongoing and time is running out. Almost $15 million has been raised so far. You can check the platform beta version here.
Related
- D2T Price Prediction
- How to Buy D2T
Join Our Telegram channel to stay up to date on breaking news coverage