
Join Our Telegram channel to stay up to date on breaking news coverage
The Bitcoin price prediction loses traction as BTC heads to the south; losses are likely to continue should it break additional supports.
Bitcoin Prediction Statistics Data:
- Bitcoin price now – $21,904
- Bitcoin market cap – $422.3 billion
- Bitcoin circulating supply – 19.2 million
- Bitcoin total supply – 19.2 million
- Bitcoin Coinmarketcap ranking – #1
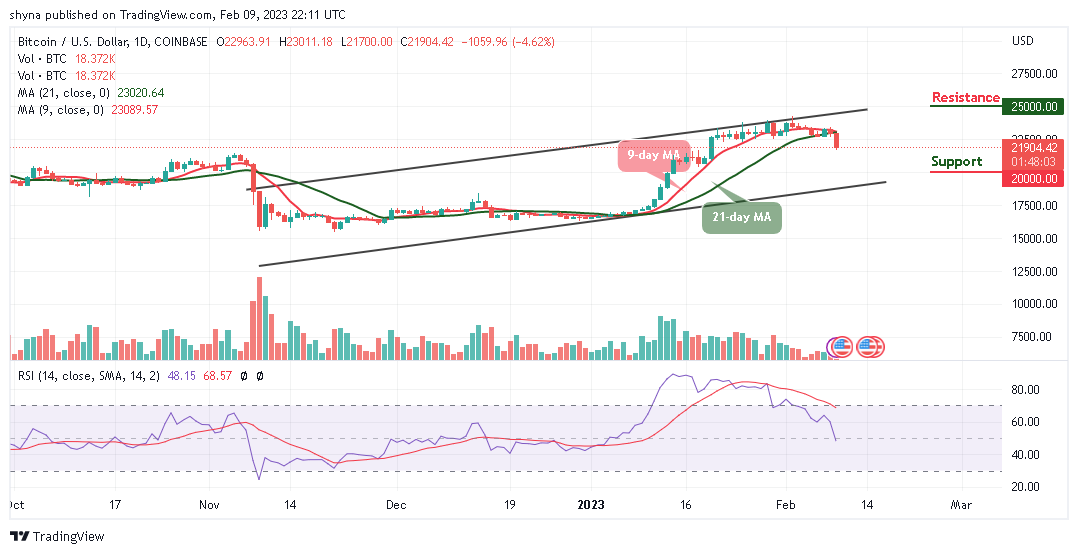
BTC/USD Long-term Trend: Ranging (Daily Chart)
Key levels:
Resistance Levels: $25,000, $27,000, $29,000
Support Levels: $20,000, $18,000, $16,000
Since the past few days, traders can easily see that BTC/USD is back in the red zone posting major losses of 4.62% on the day after commencing the trading at $22,963. However, the market movement has an intraday high of $23,011; although the world’s largest crypto touches the support level of $21,700 before going back to where it is currently trading at $21,904.
Bitcoin Price Prediction: Bitcoin (BTC) Ready to Plunge More
The Bitcoin price is just moving towards the support level of $21,500, after marking $21,700 as the current daily low in the market. Does this mean that Bitcoin (BTC) is finally searching for a new low? As the daily volume candle supports the bears, together with the 9-day moving average crossing below the 21-day moving average, it can be assumed that a stronger bearish movement may surface in the next negative movement.
However, BTC/USD is struggling to maintain the $22,000 level, if the coin continues the downward trend, the technical indicator Relative Strength Index (14) is likely to cross below the 50-level, and the next support levels may come at $20,000, $18,000, and $16,000 respectively. On the contrary, if the coin moves and cross above the upper boundary of the channel, the further bullish movement could hit the resistance levels at $25,000, $27,000, and $29,000.
BTC/USD Medium-term Trend: Bearish (4H Chart)
On the 4-Hour chart, the Bitcoin price is hovering below the 9-day and 21-day moving averages to create a new low. However, should the bulls gather enough strength and cross above the moving averages; the upward movement may be able to near the resistance level of $22,600 and above.
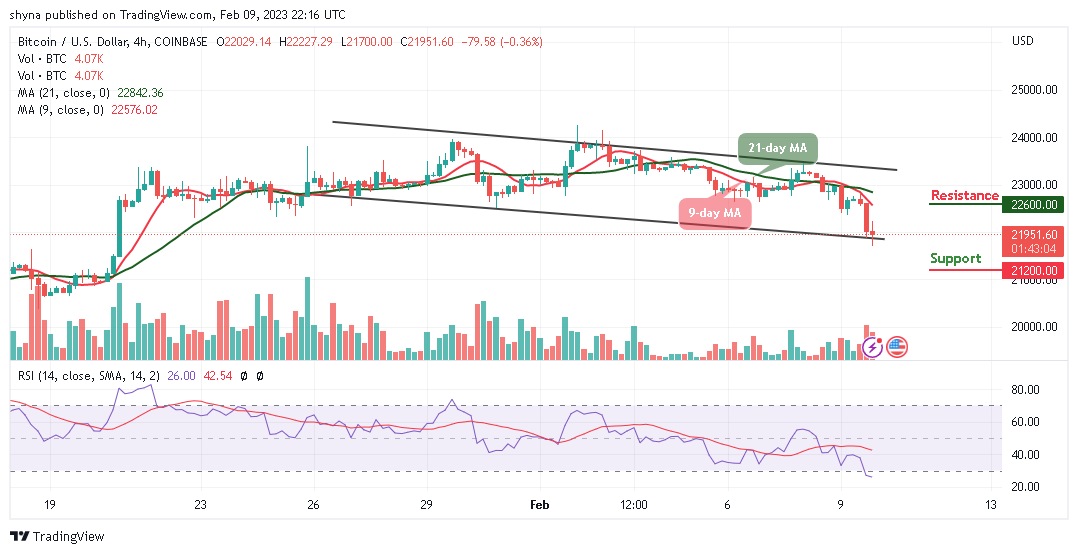
However, on the downside, immediate support could be located below the lower boundary of the channel to hit the main support at the $21,500 level. The price may likely fall furthermore and move towards the critical support level at $21,200 and below if the bears put more pressure on the market, therefore, the Relative Strength Index (14) moves into the oversold region to increase the bearish movement.
Bitcoin Alternatives
At the time of writing, the Bitcoin price is struggling to stay above $22,000 as the king coin could decline heavily if there is a close below the support level of $21,000. Nevertheless, a better new token called Meta Masters Guild (MEMAG) has achieved almost $4m in the presale. However, it will provide an excellent retail trading tool for traders who invest more in the coin.
Join Our Telegram channel to stay up to date on breaking news coverage