Join Our Telegram channel to stay up to date on breaking news coverage
The Bitcoin price prediction shows that BTC is following the two-straight bullish day as the king coin moves toward the north.
Bitcoin Prediction Statistics Data:
- Bitcoin price now – $23,909
- Bitcoin market cap – $456.8 billion
- Bitcoin circulating supply – 19.2 million
- Bitcoin total supply – 19.2 million
- Bitcoin Coinmarketcap ranking – #1
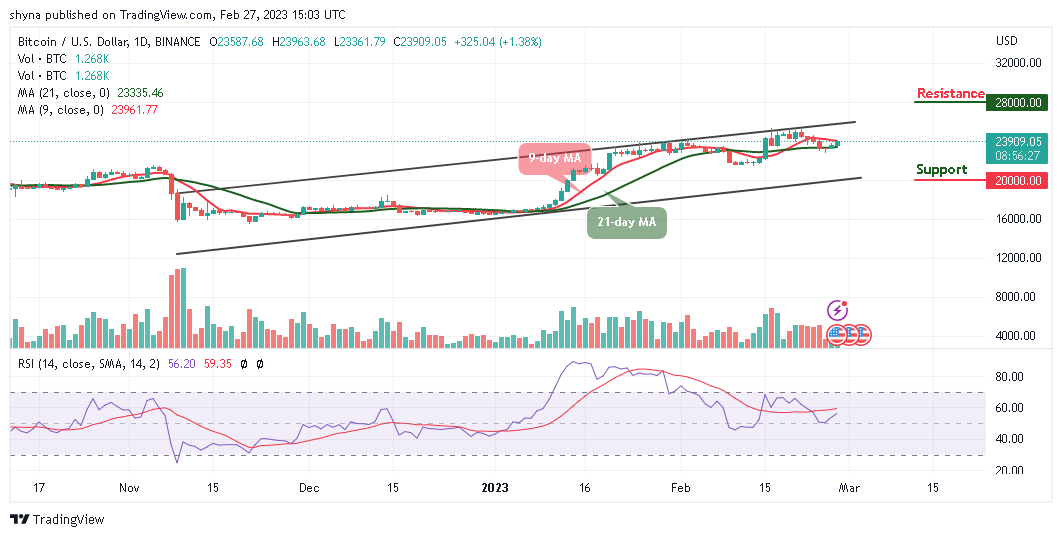
BTC/USD Long-term Trend: Ranging (Daily Chart)
Key levels:
Resistance Levels: $28,000, $30,000, $32,000
Support Levels: $20,000, $18,000, $16,000
According to the daily chart, BTC/USD is showing positive signs and might rise further above the $24,000 resistance. However, the Bitcoin price could move with strong bullish momentum after a sustainable break towards the upper boundary of the channel.
Bitcoin Price Prediction: BTC Could Move to the Upside
The technical indicator Relative Strength Index (14) shows that the Bitcoin price is ready for upward movement as the signal line moves to cross above the 60-level. Meanwhile, the Bitcoin price could struggle around the resistance level of $23,900, suggesting that the king coin could retreat a little bit, before attempting to break higher again.
On the upside, if the bulls increase the buying pressure, BTC/USD could hit the resistance level of $24,000. However, a daily close above this could lift the price to the resistance levels of $28,000, $30,000, and $32,000. On the contrary, Bitcoin could retreat and slide towards the lower boundary of the channel, if it breaks below this barrier, the critical supports could be found at $20,000, $18,000, and $16,000 respectively.
BTC/USD Medium-term Trend: Ranging (4H Chart)
According to the 4-hour chart, BTC/USD is trading above the 9-day and 21-day moving averages as the coin moves cross above the upper boundary of the channel which could touch the resistance level of $28,000 and above. Meanwhile, the Bitcoin price is likely to be range-bound if the king coin continues to move within the moving averages as buyers may keep the position intact.
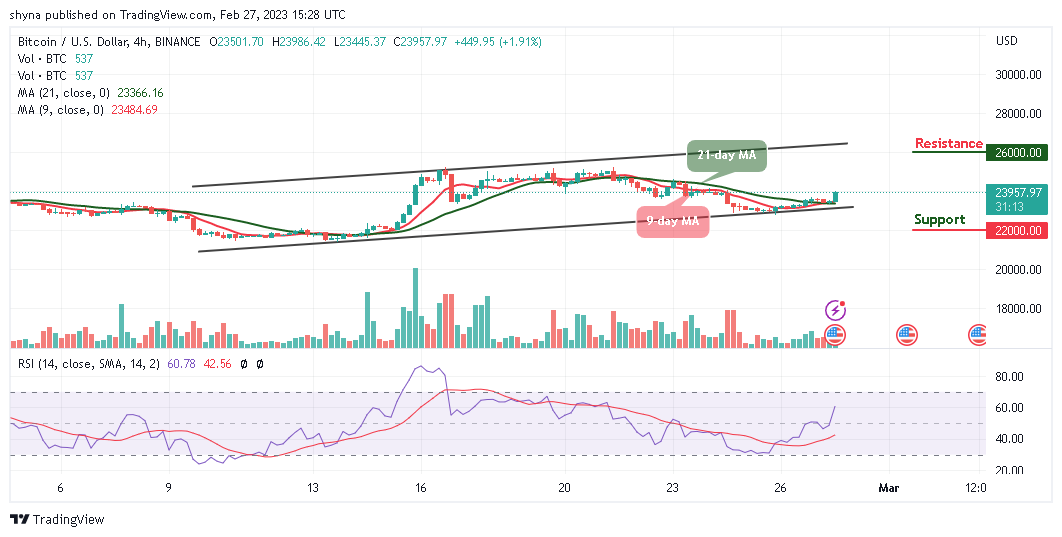
Moreover, the Relative Strength Index (14) shows that the BTC price may follow the upside as soon as the signal line crosses above the 60-level. On the contrary, if the coin slides and face the lower boundary of the channel, it could hit the support level of $17,000 and below.
Bitcoin Alternatives
The Bitcoin bulls are taking charge of the market as the king coin hovers around the $23,909 resistance level after touching the daily high of $23,963. Although the coin touched $23,361 support when the market opened during the European session, it could probably retest this level again before heading to the resistance level of $24,000. However, a new token named FightOut is planning to roll out up to 20 gyms initially, starting in the cities that have the most vibrant FightOut communities, with the platform eventually having a hub in all the world’s pre-eminent global cities as the presale still ongoing and close to $5 million has been raised so far.
Join Our Telegram channel to stay up to date on breaking news coverage