Join Our Telegram channel to stay up to date on breaking news coverage
Looking at the daily chart, the Bitcoin price prediction is showing positive signs, and it is likely to accelerate further higher in the near term.
Bitcoin Prediction Statistics Data:
- Bitcoin price now – $25,080
- Bitcoin market cap – $479.9 billion
- Bitcoin circulating supply – 19.2 million
- Bitcoin total supply – 19.2 million
- Bitcoin Coinmarketcap ranking – #1
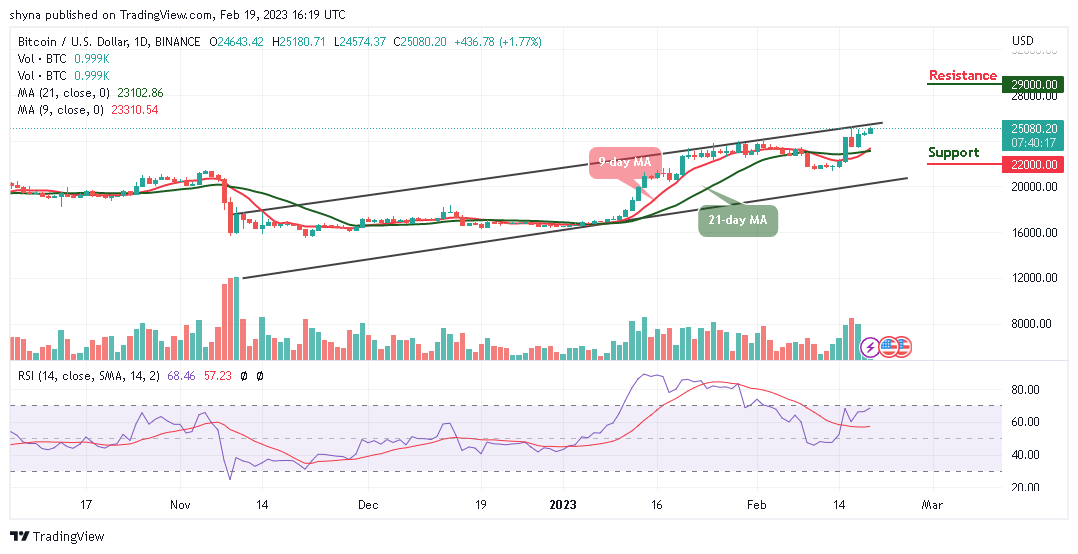
BTC/USD Long-term Trend: Bullish (Daily Chart)
Key levels:
Resistance Levels: $29,000, $30,000, $31,000
Support Levels: $22,000, $21,000, $20,000
According to the daily chart, BTC/USD breaches $25,000 as the king coin gets ready to break above the upper boundary of the channel. The first digital crypto is seen trading well above the 9-day and 21-day moving averages hovering at $25,080. Moreover, the Bitcoin price is likely to a new all-time high above the previous high of $25,180.71, which is quite remarkable.
Bitcoin Price Prediction: Bitcoin (BTC) Prepares for the Upside
Looking at the daily chart, the Bitcoin price is trading comfortably towards the upper boundary of the channel as the price establishes a new bullish signal. However, one could say that the long-term outlook favors the bulls, giving the daily close produced a bullish candle with eyes now set on the daily resistances at $29,000, $30,000, and $31,000 respectively.
In other words, any bearish movement from the current level could lead to critical supports below the 9-day and 21-day moving averages. Meanwhile, BTC could drop and touch the low of $24,000 support, once this comes to focus, the king coin can hit the support levels at $22,000, $21,000, and $20,000. Nevertheless, the technical indicator Relative Strength Index (14) is now moving to cross into the overbought region, suggesting more bullish signals.
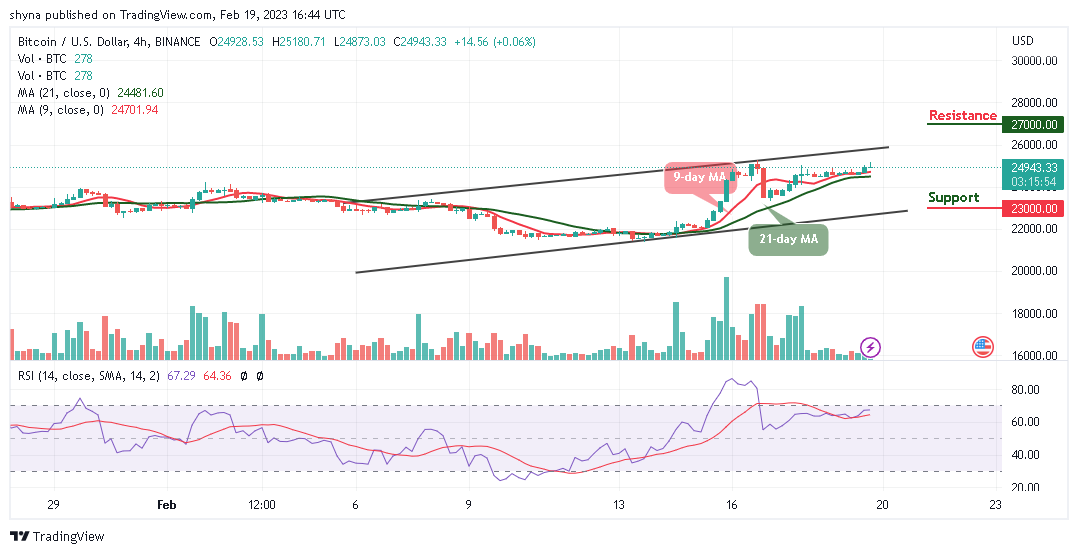
BTC/USD Medium-term Trend: Bullish (4H Chart)
Looking at the 4-hour chart, the Bitcoin price is seen trading above the 9-day and 21-day moving averages at $24,943. However, today’s price move happens to be an impressive one as it climbs above the long-awaited resistance level of $25,000 with a sharp cross. Moreover, BTC/USD is now maintaining its bull run above this level as the technical indicator Relative Strength Index (14) remains above the 60-level.

On the other hand, BTC could take a downward move if the bulls failed to push the price higher and the coin may breach below the 9-day and 21-day moving averages which could reach another support at $23,000 and below. Nevertheless, if the bulls find a decent resistance level around $25,300, the coin may continue the bullish movement above the upper boundary of the channel to hit the resistance level of $27,000 and above.
Bitcoin Alternatives
According to the daily chart, the bullish momentum of Bitcoin (BTC) seems very high at the moment, and a stable bullish movement above the $25K resistance is the more probable scenario at this time. However, there is another crypto that is naturally attracting attention from all quarters of the crypto market. Fight Out is currently in its presale phase and almost $4.5 million has been raised so far. Therefore, presale investors can earn up to 50% in bonus tokens depending on how much FGHT they purchase and how long they decide to lock it for.
Join Our Telegram channel to stay up to date on breaking news coverage


