
Join Our Telegram channel to stay up to date on breaking news coverage
The Bitcoin price prediction shows that BTC is following the three-straight bullish day as the king coin heads to the upside.
Bitcoin Prediction Statistics Data:
- Bitcoin price now – $24,961
- Bitcoin market cap – $478.8 billion
- Bitcoin circulating supply – 19.2 billion
- Bitcoin total supply – 19.2 billion
- Bitcoin Coinmarketcap ranking – #1
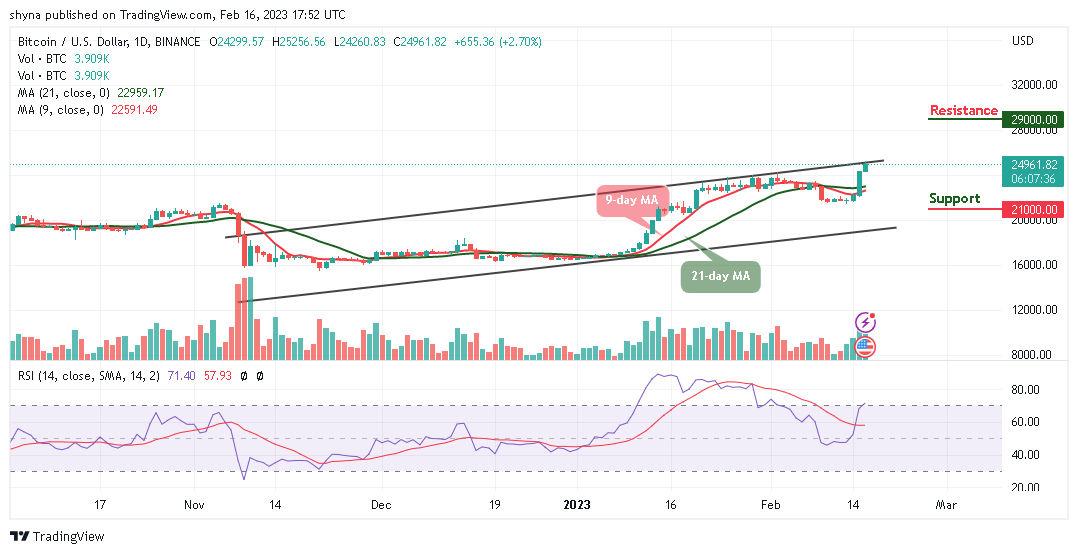
BTC/USD Long-term Trend: Bullish (Daily Chart)
Key levels:
Resistance Levels: $29,000, $31,000, $33,000
Support Levels: $21,000, $19,000, $17,000
BTC/USD is seen pushing the market price above the potential resistance level of $24,000 as bulls need to keep the price above the 9-day and 21-day moving averages. However, the Bitcoin price could move with strong bullish momentum after a sustainable break above an important resistance level of $25,000.
Bitcoin Price Prediction: Bitcoin (BTC) Would Move to the Upside
The bulls are back for good as the Bitcoin price has risen by about 3% in the last 24 hours. At the time of writing, Bitcoin (BTC) touches the daily high at $225,256. However, the technical indicator Relative Strength Index (14) prepares to cross above the upper boundary of the channel if the bulls increase the buying pressure.
On the upside, the $25,500 level aligns with the initial resistance. A daily close above this could lift the price to the resistance levels of $29,000, $31,000, and $33,000. On the contrary, the Bitcoin price could retreat and slide below the 9-day and 21-day moving averages, if the bears resume back into the market. Therefore, if it breaks toward the lower boundary of the channel, the critical supports may be located at $21,000, $19,000, and $17,000 respectively.
BTC/USD Medium-term Trend: Ranging (4H Chart)
According to the 4-hour chart, BTC/USD is currently trading above the 9-day and 21-day moving averages as the coin moves to cross above the upper boundary of the channel to hit the resistance level of $27,500 and above. Meanwhile, the Bitcoin market is likely to range-bound beyond the moving averages as the buyers keep the position intact.
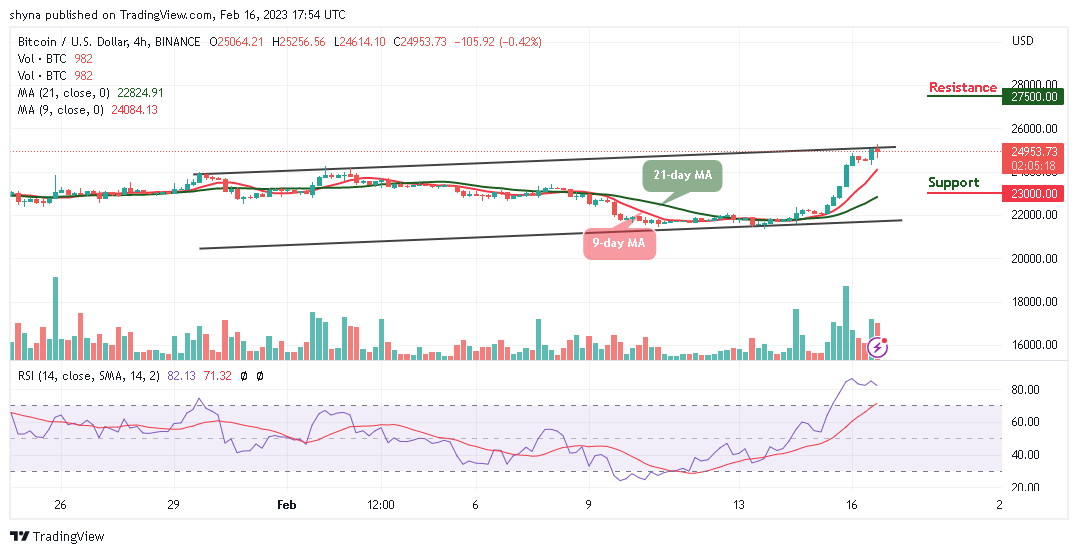
Looking at the chart, the Relative Strength Index (14) shows that the BTC price may follow the upside as the signal line remains within the overbought region. On the contrary, if the coin decides to cross below the 9-day and 21-day moving averages; the support level of $23,000 and below may be located.
Bitcoin Alternatives
According to the daily chart, the Bitcoin price surged over 10% and cleared the resistance level of $24,000 as the king coin traded above $25,000 and remains supported for more gains in the near term. However, the MEMAG token has reached over $4.7 million in the presale as of the time of writing and it will provide an excellent retail trading tool for traders who invest more in the coin.
Join Our Telegram channel to stay up to date on breaking news coverage