Join Our Telegram channel to stay up to date on breaking news coverage
The Bitcoin price prediction shows that BTC could retest the $22,000 level for it to experience a steady increase above the moving averages.
Bitcoin Prediction Statistics Data:
- Bitcoin price now – $22,233
- Bitcoin market cap – $429.3 billion
- Bitcoin circulating supply – 19.2 million
- Bitcoin total supply – 19.2 million
- Bitcoin Coinmarketcap ranking – #1
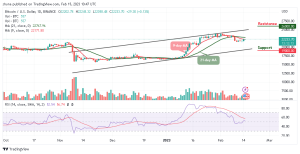
BTC/USD Long-term Trend: Ranging (Daily Chart)
Key levels:
Resistance Levels: $26,000, $27,000, $28,000
Support Levels: $19,000, $18,000, $17,000
BTC/USD is likely to recover higher should in case the bulls hold the price at $22,200 which is the support zone and the first digital asset must cross above the 9-day and 21-day moving averages to start another increase. As of the time of this writing, the Bitcoin price still sits below the 9-day and 21-day moving averages.
Bitcoin Price Prediction: Would BTC Gain More?
According to the daily chart, the Bitcoin price could gain more uptrends if it moves toward the upper boundary of the channel. Traders could see that the Bitcoin price aiming to cross above the key level of $22,300 and the 9-day MA trend line may also need to cross above the 21-day MA for the coin to move into the positive side. The Relative Strength Index (14) moves above the 50-level in an attempt to probably begin a sideways movement.
Meanwhile, a clear break above the $23,000 level could set the pace for a larger increase to the $26,000, $27,000, and $28,000 resistance levels. On the contrary, should the Bitcoin price fail to touch the nearest resistance level of $22,500, it could start a new decline and the initial support on the downside could be found below the moving averages. If there is a downside break below this barrier, the King coin could see a sharp decline toward the support levels of $19,000, $20,000, and $21,000 respectively.
BTC/USD Medium-term Trend: Ranging (4H Chart)
According to the 4-hour chart, BTC/USD keeps trading on average as the market begins to show a sign of sideways movement. Meanwhile, the intraday trading is likely to follow the bullish movement but any bearish movement toward the lower boundary of the channel could locate critical support at $19,000 and below.
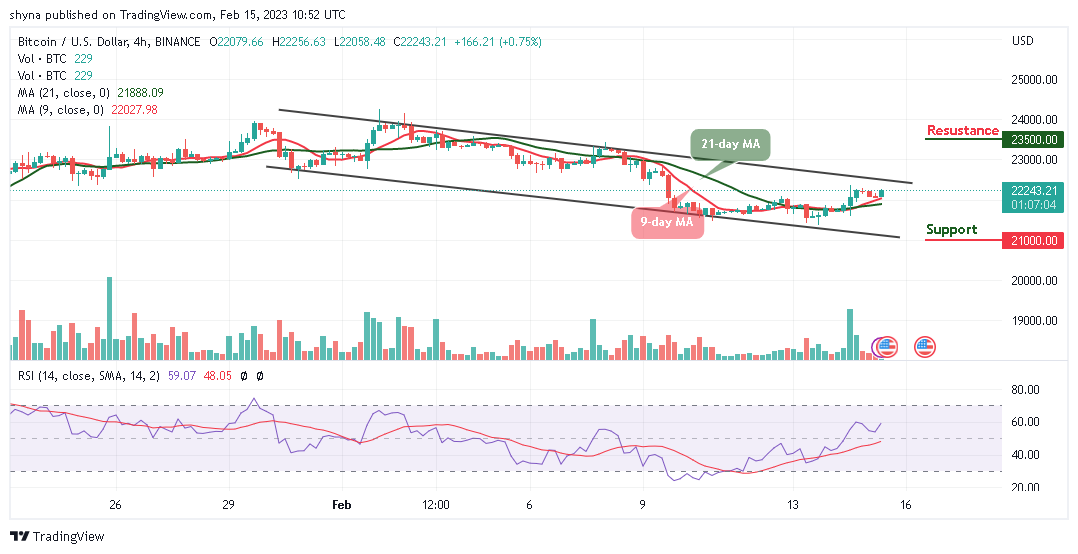
Therefore, considering the recent sharp rebound, a climb above the 21-day moving average could push the BTC price to the resistance level of $26,000 and above. As it appeared now, it seems the bears could return to the market if the Relative Strength Index (14) crosses below the 50-level, to indicate a bearish signal.
Bitcoin Alternatives
The Bitcoin price is attempting an upside correction above the $22,000 resistance but the king coin needs to clear the resistance levels of $22,350 and $22,400 to continue moving higher in the near term. Meanwhile, the MEMAG token is still selling very hot in the market as over $4.5 million has been raised in the presale. Smart investors are therefore expected to embrace the coin before the end of the presale.
Join Our Telegram channel to stay up to date on breaking news coverage