Join Our Telegram channel to stay up to date on breaking news coverage
The Bitcoin price prediction sees a 0.46% decline over the past few hours as the cryptocurrency fails at $21,899 and could head lower.
Bitcoin Prediction Statistics Data:
- Bitcoin price now – $21,692
- Bitcoin market cap – $417.6 billion
- Bitcoin circulating supply – 19.2 million
- Bitcoin total supply – 19.2 million
- Bitcoin Coinmarketcap ranking – #1
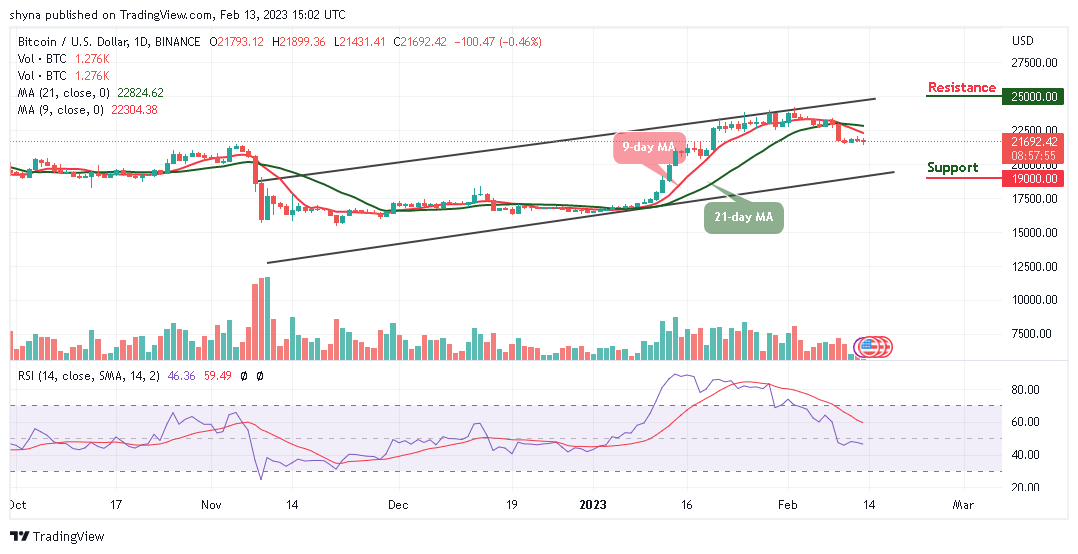
BTC/USD Long-term Trend: Ranging (Daily Chart)
Key levels:
Resistance Levels: $25,000, $27,000, $29,000
Support Levels: $19,000, $17,000, $15,000
BTC/USD loses its momentum after touching key resistance above $21,899. As of writing, the king coin is down 0.46% on the day at $21,692 hovering below the 9-day and 21-day moving averages. Meanwhile, the Bitcoin price may struggle to close above $21,700, and if it does, it should be free to rise well above $22,000 if it moves toward the upper boundary of the channel.
Bitcoin Price Prediction: Can Bitcoin Price Trade Above $22,000?
After a slightly positive move above $21,800, the Bitcoin price could remain below the 9-day and 21-day moving averages. Over the past few days, the king coin has been struggling for the bullish movement. In today’s session, the Bitcoin price attempted to push higher, but the sellers stepped into the market to bring the market price lower to touch the daily low of $21,431.
Moreover, if the coin moves lower, the $21,000 may serve as the nearest support level, which may likely make room for the coin to fall further to hit the supports at $19,000, $17,000, and $15,000. The Relative Strength Index (14) remains below the 50- level, which could follow the downward movement. On the contrary, BTC/USD may likely face the upper boundary of the channel to hit the resistance levels of $25,000, $27,000, and $29,000.
BTC/USD Medium-term Trend: Bearish (4H Chart)
On the 4-Hour chart, the BTC price hovers around $21,647 and may likely cross above the 9-day and 21-day moving averages. However, if the bulls gather enough strength, the upward movement may be near the resistance level of $22,500 and above.
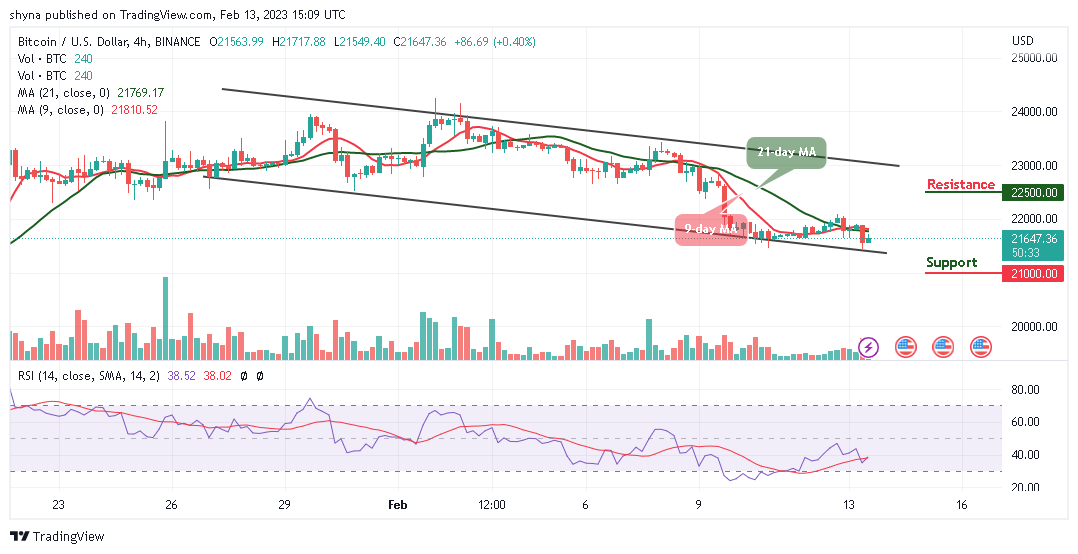
On the downside, immediate support could be located around the $21,300 level while critical support is at $21,000 and below. Therefore, the Bitcoin price may likely fall below the lower boundary of the channel if the bears put more pressure on the market, Moreover, the Relative Strength Index (14) keeps moving below the 40-level, suggesting a sideways movement.
Bitcoin Alternatives
The Bitcoin price is at the moment moving sideways, if the king coin moves above the resistance level of $22k, it is likely to resume upward movement but if not, there could be more negative movements in the market. However, the Meta Masters Guild has become one of the most popular crypto presales of the year, raising almost $4.5 million as it continues its presale to end the fundraising round in less than five days.
Join Our Telegram channel to stay up to date on breaking news coverage