Join Our Telegram channel to stay up to date on breaking news coverage
After touching the daily high of $21,795, the Bitcoin price prediction shows that BTC is yet to create additional bullish movement; no quick recovery seems possible at the moment.
Bitcoin Prediction Statistics Data:
- Bitcoin price now – $21,651
- Bitcoin market cap – $418.3 billion
- Bitcoin circulating supply – 19.2 million
- Bitcoin total supply – 19.2 million
- Bitcoin Coinmarketcap ranking – #1
BTC/USD Long-term Trend: Ranging (Daily Chart)
Key levels:
Resistance Levels: $25,000, $27,000, $29,000
Support Levels: $18,000, $16,000, $14,000
BTC/USD is likely to drop more as the king coin remains below the 9-day and 21-day moving averages. The buying strength of the first digital asset slowly faded after it retraced the resistance level of $24,262 that it touched at the beginning of this month. However, the Bitcoin market remains sensitive as the price remains in the clutches of the bears.
Bitcoin Price Prediction: Would Bitcoin Face the Downward Trend?
The Bitcoin price is currently trading below the 9-day and 21-day moving averages. If the bulls try to move up the market price slightly, then BTC might see relief in price action and try moving close to its crucial resistance level of $23,000. Meanwhile, the market capitalization of BTC drops considerably, which indicates that selling strength could build up in the market, and Bitcoin (BTC) could drop to the critical supports of $25,000, $27,000, and $28,000 respectively.
However, if BTC/USD continues to trade near the support level of $21,000, the king coin could witness another price drop but a bullish movement above the $22,000 level can take the price to the resistance level of $23,500. Meanwhile, the key breakout zone could be located near the $25,000, $27,000, and $29,000 resistance levels. On the other hand, if the coin doesn’t go north, the first fall can be at $21,000 and then at $20,000. The Relative Strength Index (14) is moving below the 50-level, suggesting bearish signals in the market.
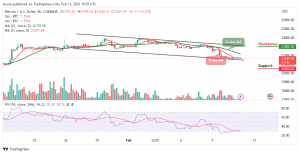
BTC/USD Medium-term Trend: Ranging (4H Chart)
The Bitcoin price is at the moment hovering below the 9-day moving average, bringing its price from $21,741 to reach a daily low of $21,620. However, if the price drops further, it could reach the support level of $20,500 and below.

Nonetheless, if bulls push the coin toward the upper boundary of the channel, the Bitcoin price could hit the potential resistance level of $23,000 and above. At the moment, the market is trading at the downside as the Relative Strength Index (14) indicator moves around the 30-level.
Bitcoin Alternatives
According to the daily chart, the Bitcoin price is yet to show a tremendous movement above the $22,000 resistance, therefore, the king coin is likely to drop more if crosses below the $21,000 support. Moreover, the new token called MEMAG is still doing well in the market as almost $4 million has been raised so far in the presale. The investors are therefore encouraged to invest before the end of the presale.
Join Our Telegram channel to stay up to date on breaking news coverage