Join Our Telegram channel to stay up to date on breaking news coverage
The Bitcoin price prediction shows that BTC is trading above the resistance level of $16,800 as bears could have the upper hand.
Bitcoin Prediction Statistics Data:
- Bitcoin price now – $16,841
- Bitcoin market cap – $324 billion
- Bitcoin circulating supply – 19.2 million
- Bitcoin total supply – 19.2 million
- Bitcoin Coinmarketcap ranking – #1
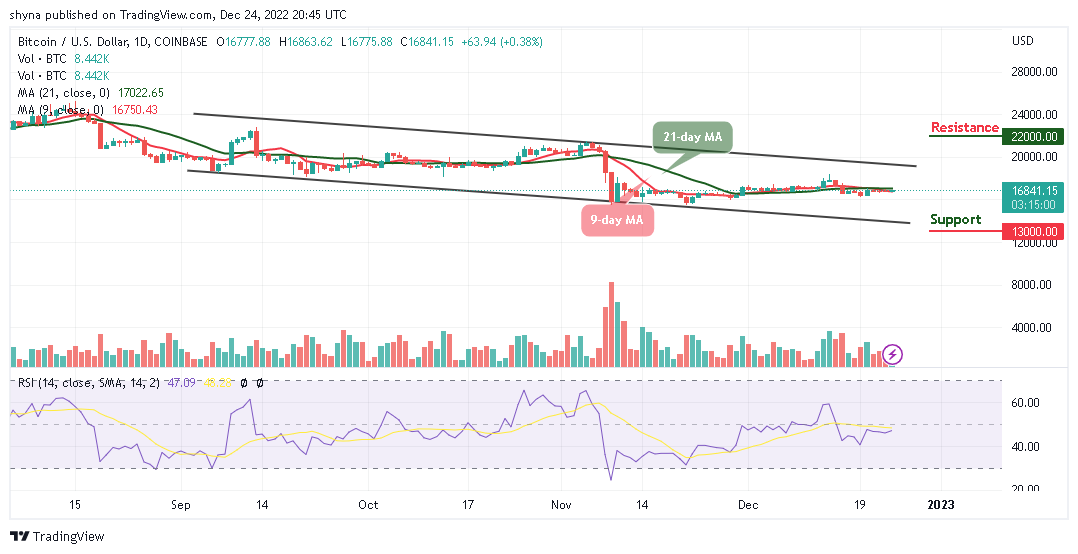
BTC/USD Long-term Trend: Ranging (Daily Chart)
Key levels:
Resistance Levels: $22,000, $24,000, $26,000
Support Levels: $13,000, $11,000, $9,000
BTC/USD is trading at $16,841 after recovering from the daily low of $16,775. The first digital asset is moving to cross above the 9-day and 21-day moving averages but it could face trade bearishly if the bears step back into the market.
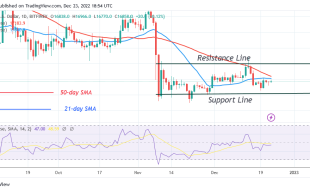
Bitcoin Price Prediction: Bitcoin (BTC) Bears May Resume
According to the daily chart, the Bitcoin price needs to cross above the 9-day and 21-day moving averages, if not, there may come a bearish breakdown if BTC/USD falls back to the support of $15,000. The 9-day MA is likely to cross above the 21-day MA as the technical indicator Relative Strength Index (14) moves to cross above 50-level which is more likely a bullish trend at the time of the outcome.
However, BTC/USD may confirm the bullish trend if the market price touches the resistance level of $18,000. In other words, the Bitcoin price may follow the bearish trend if the price slides and face the lower boundary of the channel. Should this come to focus, BTC/USD may hit the supports of $13,000, $11,000, and $9,000. Otherwise, a strong bullish spike may push the price above the upper boundary of the channel which could touch the resistance levels of $22,000, $24,000, and $26,000.
BTC/USD Medium-term Trend: Ranging (4H Chart)
Looking at the 4-hour chart, the Bitcoin price is likely to cross above the 9-day and 21-day moving averages if the bulls put in more effort. However, if the price continues to rise further and pushes it above the upper boundary of the channel, it could reach the potential resistance level of $18,000 and above.
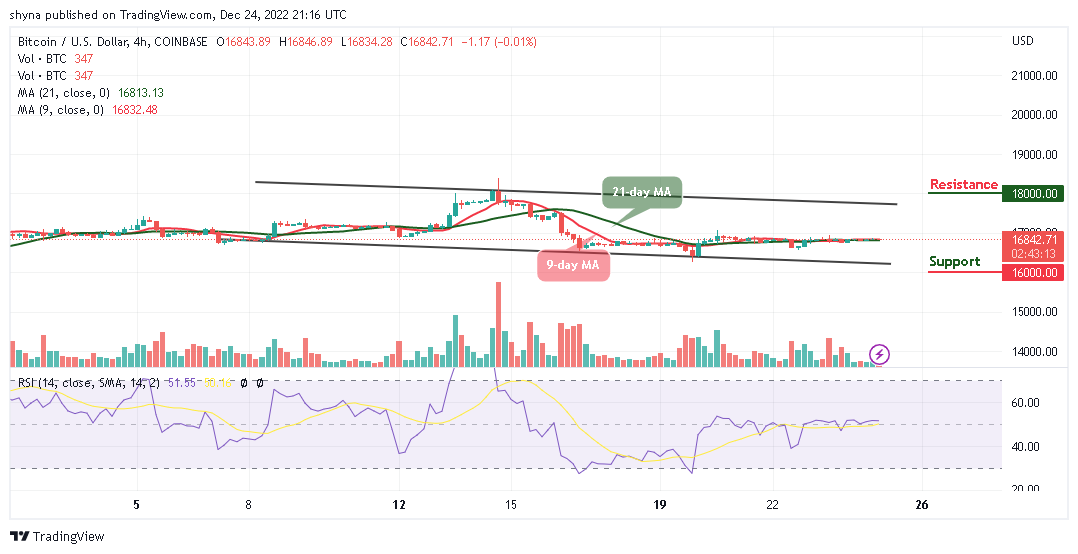
Nonetheless, if the bears bring the coin below the lower boundary of the channel, the Bitcoin price could reach the closest support at $16,000 and below. At the moment, the technical indicator Relative Strength Index (14) is seen moving above the 50-level, suggesting a bullish trend for the market.
Nevertheless, Dash 2 Trade gives you the ability to optimize your trading and speculative profitability with effective crypto trading recommendations, auto trading, and analytics features. There is a D2T token presale ongoing and time is running out. The presale dashboard launch is coming soon since the product dev is ahead of the schedule. So far, the presale has raised almost $11 million.
Related
- D2T Price Prediction
- How to Buy D2T
Join Our Telegram channel to stay up to date on breaking news coverage