
Join Our Telegram channel to stay up to date on breaking news coverage
After touching the daily high of $16,868.82, the Bitcoin price prediction reveals that BTC drops 1.13% as it trades around the $16,635 level.
Bitcoin Prediction Statistics Data:
- Bitcoin price now – $16,635.68
- Bitcoin market cap – $320.9 billion
- Bitcoin circulating supply – 19.2 million
- Bitcoin total supply – 19.2 million
- Bitcoin Coinmarketcap ranking – #1
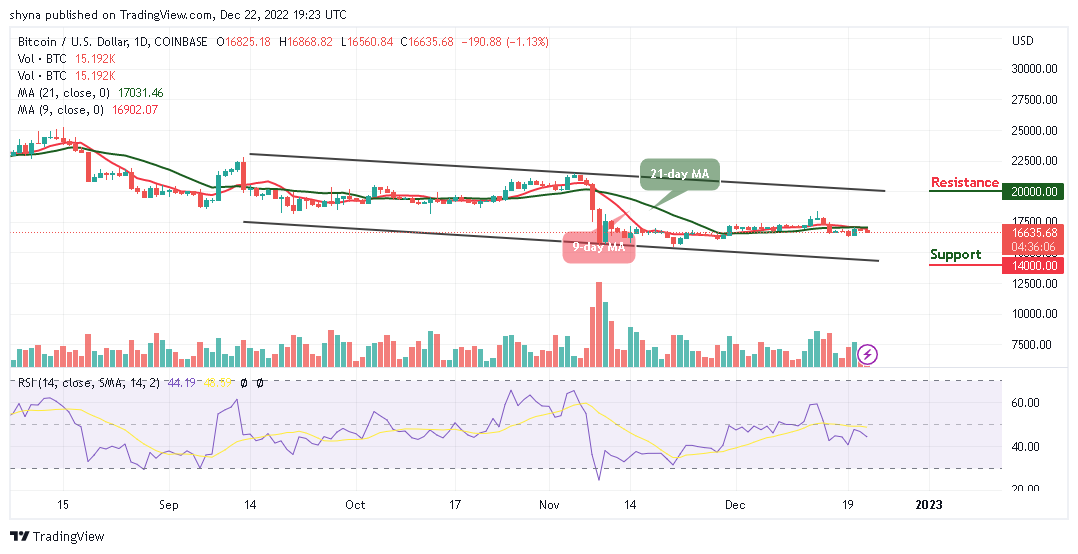
BTC/USD Long-term Trend: Ranging (Daily Chart)
Key levels:
Resistance Levels: $20,000, $22,000, $24,000
Support Levels: $14,000, $12,000, $10,000
With the current movement and the fact that BTC/USD is seen hovering at $16,635, it is likely that the king coin will keep trading below both the 9-day and 21-day moving averages. On the other side, Bitcoin (BTC) is heading toward the $16,000 support to begin the day; if it crosses below the lower channel boundary, it may find the first support level at $15,000. Other support levels could be at $14,000, $12,000, and $10,000.
Bitcoin Price Prediction: Bitcoin (BTC) May Cause a New Increase in Price
With the support of $16,000, the Bitcoin price might start to embark on a recovery effort. The first digital asset, however, is presently trading at $16,635, as bulls were unable to raise the cryptocurrency above the 9-day and 21-day moving averages. On the downside, support might be offered right away near the $16,500 level. According to the crypto market stability, short-term support is essential for maintaining the upswing.
Although the Bitcoin price could not rise any higher, it did fall below the moving averages. Although the candle has not yet closed, the bulls are likely to close above the $16,800 resistance level. Furthermore, if the technical indicator Relative Strength Index (14) rises above the 50-level, resistance levels could be found at $20,000, $22,000, and $24,000.
BTC/USD Medium-term Trend: Ranging (4H Chart)
According to the 4-hour chart, bears are likely to re-enter the market if the bulls fail to defend the $16,500 support level. However, the 9-day moving average is seen crossing below the 21-day moving average, indicating that the crypto is likely to fall. As a result, $15,800 and below may come into play if the bearish trend continues in the market.
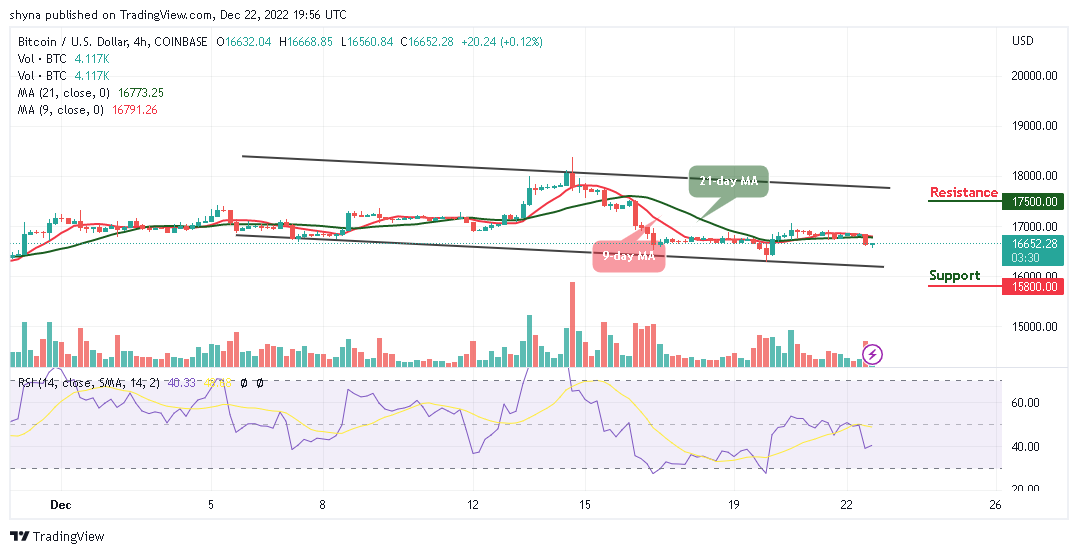
However, if buyers push the market price above the moving averages, traders can expect a retest of the $17,000 resistance level; breaking this level may allow the bulls to reach the potential resistance level of $17,500 and above. The technical indicator Relative Strength Index (14) is currently moving around the 40-level, which could give additional bullish signals in the next positive move.
Nevertheless, Dash 2 Trade gives you the ability to optimize your trading and speculative profitability with effective crypto trading recommendations, auto trading, and analytics features. There is a D2T token presale ongoing and time is running out. The presale dashboard launch is coming soon since the product dev is ahead of the schedule. So far, the presale has raised almost $11 million.
Related
- D2T Price Prediction
- How to Buy D2T
Join Our Telegram channel to stay up to date on breaking news coverage