Join Our Telegram channel to stay up to date on breaking news coverage
The Bitcoin price prediction shows that BTC is seeing some green during this week’s market opening and seems poised to reclaim higher levels in the short term.
Bitcoin Prediction Statistics Data:
- Bitcoin price now – $17,757
- Bitcoin market cap – $342.4 billion
- Bitcoin circulating supply – 19.2 billion
- Bitcoin total supply – 19.2 billion
- Bitcoin Coinmarketcap ranking – #1
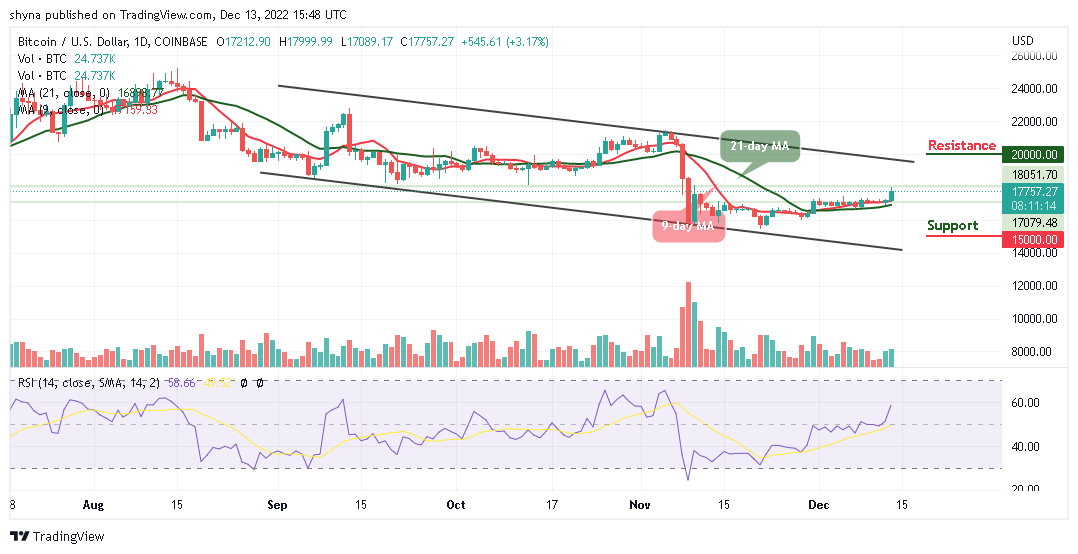
BTC/USD Long-term Trend: Ranging (Daily Chart)
Key levels:
Resistance Levels: $20,000, $22,000, $24,000
Support Levels: $15,000, $13,000, $11,000
BTC/USD is seen pushing the market price above the potential resistance level of $17,500 as bulls need to keep the price above the 9-day and 21-day moving averages. In the past few months, the number one crypto by market cap experienced some of its worst months in history, but the bulls were able to hold the line at around $15,500.
Bitcoin Price Prediction: Bitcoin (BTC) Could Move to the Upside
Looking at the daily chart, the technical indicator Relative Strength Index (14) moves into the overbought as the bulls appear to push the Bitcoin price above the upper boundary of the channel. Moreover, the Bitcoin price seems to be struggling around the upper boundary of the channel, suggesting that BTC/USD could retreat a little bit, before attempting to break higher again.
On the upside, the $17,700 level aligns with the initial resistance. A daily close above this could lift the price to the resistance levels of $20,000, $22,000, and $24,000 respectively. On the contrary, if the bears step back into the market, the Bitcoin price could retreat and slide below the 21-day moving average, currently located at $17,757. However, if it breaks toward the lower boundary of the channel, the critical supports could be located at $15,000, $13,000, and $11,000.
BTC/USD Medium-term Trend: Bullish (4H Chart)
According to the 4-hour chart, BTC/USD is currently trading above the 9-day and 21-day moving averages as the coin moves to cross above the upper boundary of the channel which could hit the resistance level of $18,500 and above.
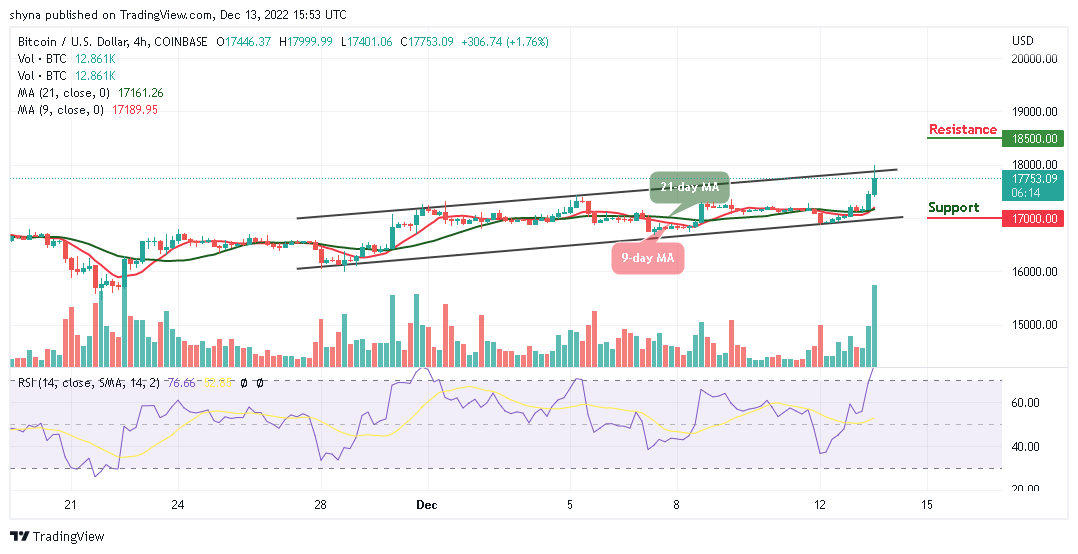
Looking at the technical indicator, the Relative Strength Index (14) shows that the BTC price may follow the upside as the signal line remains within the overbought region. In other words, if the coin decides to cross below the 9-day and 21-day moving averages; the support level of $17,000 and below may be located.
Dash 2 Trade gives you the ability to optimize your trading and speculative profitability with effective crypto trading recommendations, auto trading, and analytics features. There is a D2T token presale ongoing and time is running out. The presale dashboard launch is coming soon since the product dev is ahead of the schedule. So far, the presale has raised almost $10 million.
Related
- D2T Price Prediction
- How to Buy D2T
Join Our Telegram channel to stay up to date on breaking news coverage