
Join Our Telegram channel to stay up to date on breaking news coverage
The daily chart reveals that the Bitcoin price prediction may extend the bearish movement to the areas below the support level of $27,000.
Bitcoin Prediction Statistics Data:
- Bitcoin price now – $27,431
- Bitcoin market cap – $528.1 billion
- Bitcoin circulating supply – 19.3 million
- Bitcoin total supply – 19.3 million
- Bitcoin Coinmarketcap ranking – #1
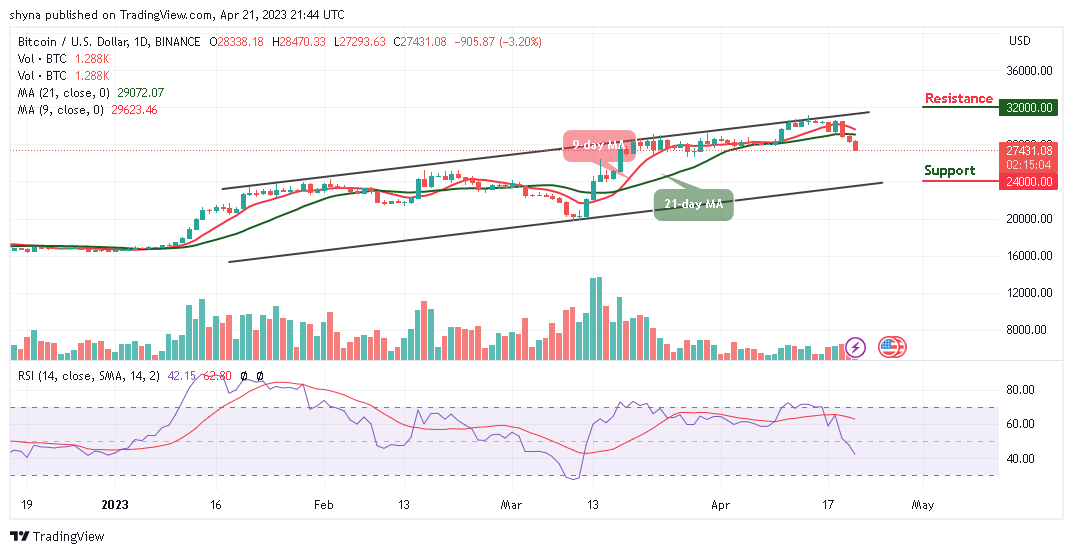
BTC/USD Long-term Trend: Bullish (Daily Chart)
Key levels:
Resistance Levels: $32,000, $34,000, $36,000
Support Levels: $24,000, $22,000, $20,000
BTC/USD falls below $27,500 once again as the first digital asset embarks on support after the coin failed to hold above the resistance level of $28,500. According to the daily chart, the bearish control is seen across the market as the sellers are making effort to increase the bearish movement.
Bitcoin Price Prediction: Bitcoin (BTC) Could Touch $27k Support
The Bitcoin price is hovering at $27,431 with an intraday loss of 3.20%. Looking at the daily chart, the prevailing trend is bearish with expanding volatility as the first digital asset is likely to consolidate in a bearish flag pattern. Meanwhile, a breakdown toward the lower boundary of the channel is supposed to continue in the direction of the previous trend. In this case, BTC/USD is expected to drop and stay below to hit the critical support levels at $24,000, $22,000, and $20,000.
However, should the Bitcoin price return above the 9-day and 21-day moving averages; the price could rise to the nearest resistance at $28,000. A further bullish drive could push the price to $32,000, $34,000, and $36,000 resistance levels. The technical indicator Relative Strength Index (14) is revealing a bearish movement, which shows that the market may continue to move down.
BTC/USD Medium-term Trend: Ranging (4H Chart)
At the opening of the market today, the Bitcoin price may begin to follow the bullish movement to touch the resistance level of $28,000 but could drop below the lower boundary of the channel to bring its price to $26,500 support. Moreover, should the price drop and stay below the channel, it could touch the support level of $25,000 and below.
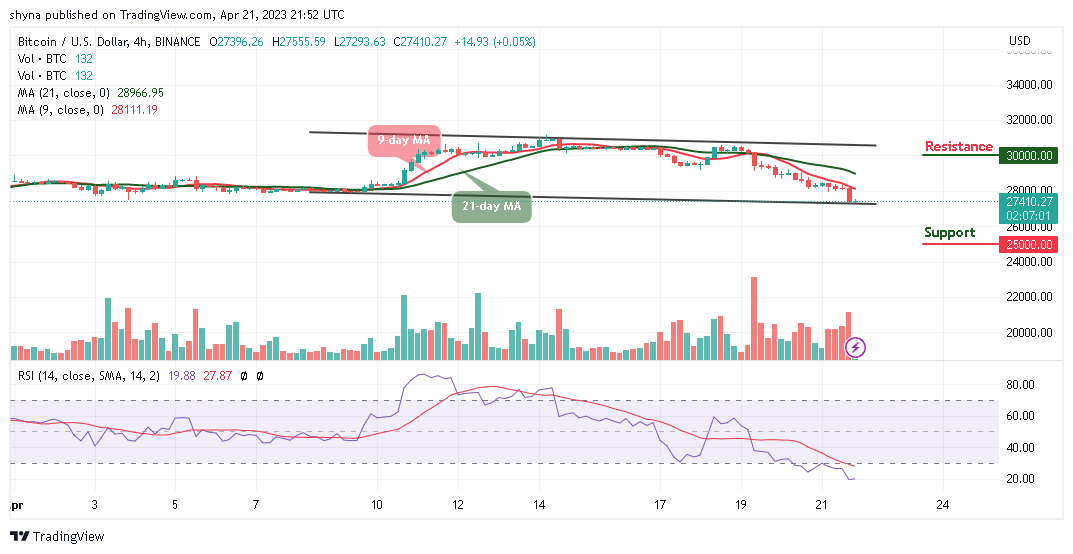
Nonetheless, if the bulls push the king coin above the 21-day moving average, the Bitcoin price could touch the resistance level of $30,000 and above. At the moment, the market may begin to move sideways or experience downtrends as the Relative Strength Index (14) moves in the same direction within the oversold region.
Bitcoin Alternatives
The Bitcoin price may not drop much, but if the first digital coin breaks below the $26,000 support, it could make the king coin face the lower boundary of the channel. Alternatively, Bitcoin (BTC) may reclaim the previous resistance level of $28,000 to head to the upside. If successful, BTC/USD could aim at higher levels. On that note, Love Hate Inu is creating a safe space for people to share their opinions with other people who care what they think, and who don’t criticize them for having that opinion. From an investment standpoint, Love Hate Inu is a good buy because of the viral nature of the platform and the token has raised almost $5.5m in the presale.
Read more:
- Bitcoin Price Prediction: BTC/USD Crashes to $10,300 Low, a Further Decline Is Likely
Join Our Telegram channel to stay up to date on breaking news coverage