Join Our Telegram channel to stay up to date on breaking news coverage
The Bitcoin price prediction is currently trading above the 9-day moving average after the first digital asset recovers from $41,000.
BTC/USD Long-term Trend: Ranging (Daily Chart)
Key levels:
Resistance Levels: $46,000, $48,000, $50,000
Support Levels: $38,000, $36,000, $34,000

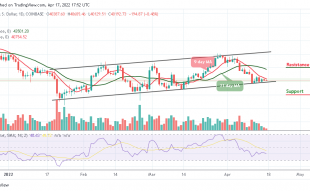
BTC/USD is currently holding above the $42,000 level as the coin prepares for another push higher. Looking at the daily chart, the Bitcoin price is now attempting to maintain the bullish movement towards the upper boundary of the channel but may struggle to gain momentum as the entire market’s uptrend stalls.
Bitcoin Price Prediction: Bitcoin Price May Create More Upsides
The Bitcoin price is currently trading at $42,142 with a gain of 1.54% on the day. The trading is likely to cross above the 21-day moving average as the technical indicator Relative Strength Index (14) prepares to cross above the 50-level. The bulls must reclaim this barrier as this would allow them to focus on higher levels towards $45,000. On the other side, any declines below the 9-day moving average could easily open the way to the south.
Looking at the daily chart, Bitcoin (BTC) is likely to regain ground by moving the market price to the next level. Moreover, any bullish movement towards the upper boundary of the channel may push the price to the resistance level of $46,000, $48,000, and $50,000, while the supports could be located at $38,000, $36,000, and $34,000 respectively.
BTC/USD Medium-Term Trend: Ranging (4H Chart)
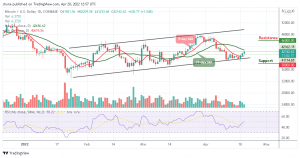
Looking at the 4-hour chart, the Bitcoin price remains above the 9-day and 21-day moving averages as the coin faces the upside. However, if the price continues to rise further and crosses above the upper boundary of the channel, it could reach the nearest resistance levels at $44,000, $46,000, and $48,000 respectively.
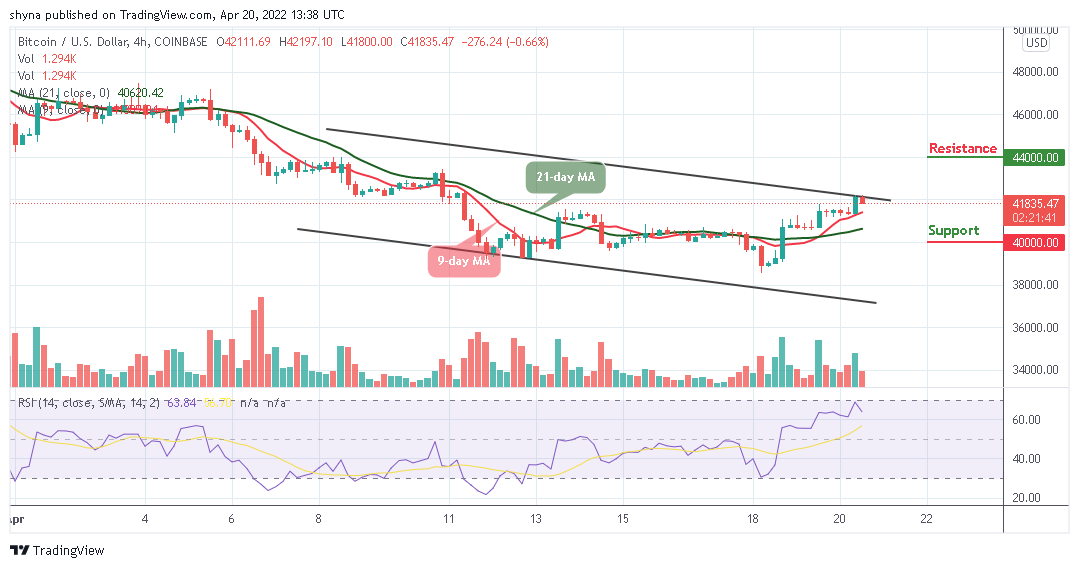
Moreover, if the bears bring the coin below the 9-day and 21-day moving averages; it may likely hit the closest supports at $40,000, $38,000, and $36,000. Presently, the technical indicator Relative Strength Index (14) is likely to cross below the 60-level for the coin to retreat a little bit.
Looking to buy or trade Bitcoin (BTC) now? Invest at eToro!
68% of retail investor accounts lose money when trading CFDs with this provider
Read more:
- How to buy Bitcoin
- How to buy Cryptocurrency
Join Our Telegram channel to stay up to date on breaking news coverage