Join Our Telegram channel to stay up to date on breaking news coverage
The Bitcoin price prediction slides below the resistance level of $40,605. Further downside momentum appears to be imminent, but $40,000 may likely come out as support.
BTC/USD Long-term Trend: Ranging (Daily Chart)
Key levels:
Resistance Levels: $44,000, $46,000, $48,000
Support Levels: $36,000, $34,000, $32,000

BTC/USD soars to $40,605 in the early hours of today’s trading. Therefore, BTC/USD is hovering at $40,192 after dropping from the daily high. More so, where Bitcoin will go next after this retreat is likely to depend on the ability of the bulls to hold the price above the key support at $40,000.
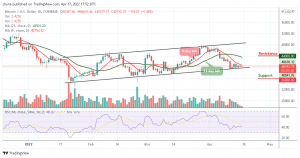
Bitcoin Price Prediction: Would Bitcoin Go Up?
The Bitcoin price remains intact below the 9-day and 21-day moving averages; however, a further retracement seems imminent, and it is likely to break below $40,000. Meanwhile, looking at the chart, $36,000, $34,000, and $32,000 serve as the major support levels, making room for BTC to fall even further. The technical indicator Relative Strength Index (14) is still moving around the 40-level, suggesting sideways movement.
However, as the daily chart reveals, if the bulls could push the price back above the daily high at $40,605, BTC/USD may see a potential resistance level at $42,000, any further movement could send it to other resistance levels at $44,000, $46,000, and $48,000 respectively.
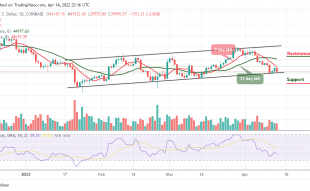
BTC/USD Medium-Term Trend: Bearish (4H Chart)
Looking at the 4-hour chart, the bears are coming back into the market as the market price moves below the 9-day and 21-day moving averages. The bulls failed to hold the Bitcoin price above the moving averages. Meanwhile, if BTC/USD breaks above the channel, the $42,000 and above may come into play.
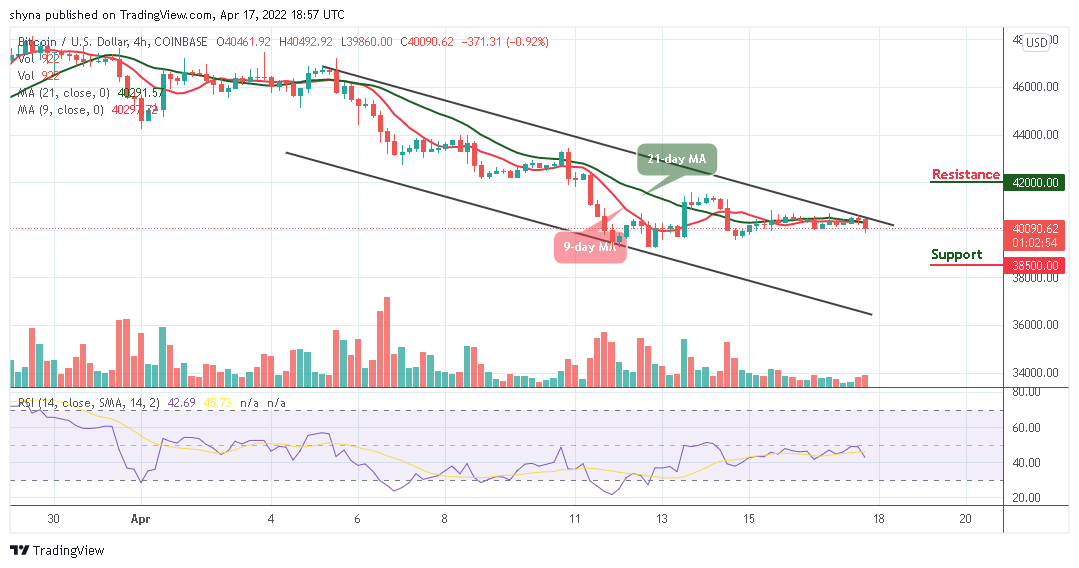
However, if the price breaks toward the lower boundary of the channel and falls more, the support levels of $38,500 and below may be in focus. Meanwhile, as the Relative Strength Index (14) nosedives below 50-level, more bearish signals may play out before a rebound could come in.
Looking to buy or trade Bitcoin (BTC) now? Invest at eToro!
68% of retail investor accounts lose money when trading CFDs with this provider
Read more:
- How to buy Bitcoin
- How to buy Cryptocurrency
Join Our Telegram channel to stay up to date on breaking news coverage