Join Our Telegram channel to stay up to date on breaking news coverage
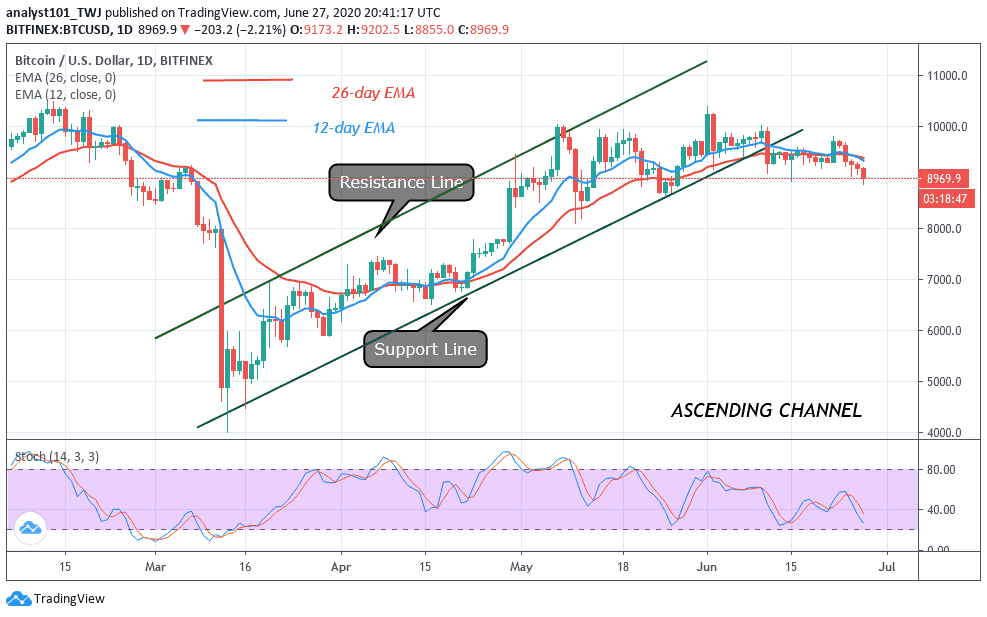
Bitcoin Price Prediction (BTC) – June 27
Today, the Bitcoin price tumbles below $9,000; recording the loss of at least $1,000 in 5-days.
BTC/USD Long-term Trend: Ranging (Daily Chart)
Key levels:
Resistance Levels: $9,800, $10,000 $10,200
Support Levels: $8,100, $7,900, $7,700
After a long battle to maintain the $9,000 mark, BTC/USD has finally lost, and immediately plunged to $8,816, which happens to be the current daily low. At the time of writing this article, BTC/USD is trading below the 9-day and 21-day moving averages, with a short-term bearish bias. The coin is losing about 2.38% in the last 24 hours while the pair is being affected by the current slowdown in the entire crypto market.
Moreover, the daily chart reveals that the prevailing trend is bearish with expanding volatility. The leader of cryptocurrencies currently consolidates in a bearish flag pattern. A breakdown below this pattern is supposed to continue in the direction of the previous trend. In this case, we expect Bitcoin to rise above $9,500 resistance and move towards the potential resistance levels at $9,800, $10,000, and $10,200.
However, should Bitcoin price failed to move above the moving averages and move up; the price could drop to $8,800 vital support. A further low drive could send the price to $8,100, $7,900, and $7,700 support. The technical indicator RSI (14) is presently revealing a sign of trend reversal, which shows a possible more bearish momentum below the lower boundary of the channel.
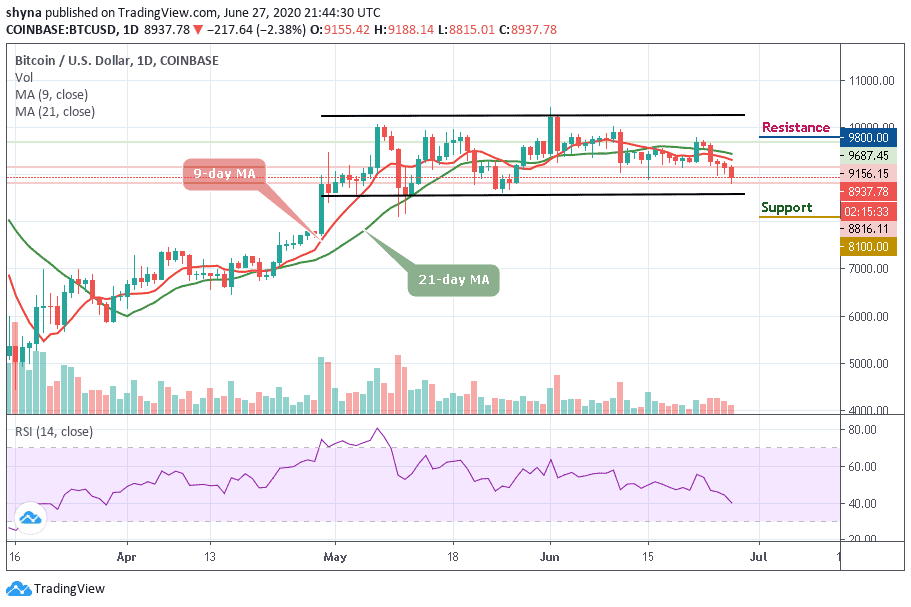
BTC/USD Medium-term Trend: Bearish (4H Chart)
According to the 4-hour chart, with the sudden move of Bitcoin price above $8,900, Bitcoin’s chances of violating the old support of $9,000 now became resistance. The bulls are not out of the wood yet and a break above $9,100 is needed to invalidate the bearish case as RSI (14) is moving out from the oversold zone.

In addition, a high-volume break above $9,200 would violate the bearish pattern of the highs and shift the risk to a rise of $9,300 and above. In particular, the movement above $9,500 is supported by an increase in buying volumes. In other words, the Bitcoin price could come back to $8,800 within the next few days before reaching another supports of $8,600 and beyond.
Join Our Telegram channel to stay up to date on breaking news coverage