Join Our Telegram channel to stay up to date on breaking news coverage
Bitcoin (BTC) Price Prediction – December 23
In the past five days, BTC/USD has shown a growth of over 18% ranging to $7,676.57 from $6,445.34.
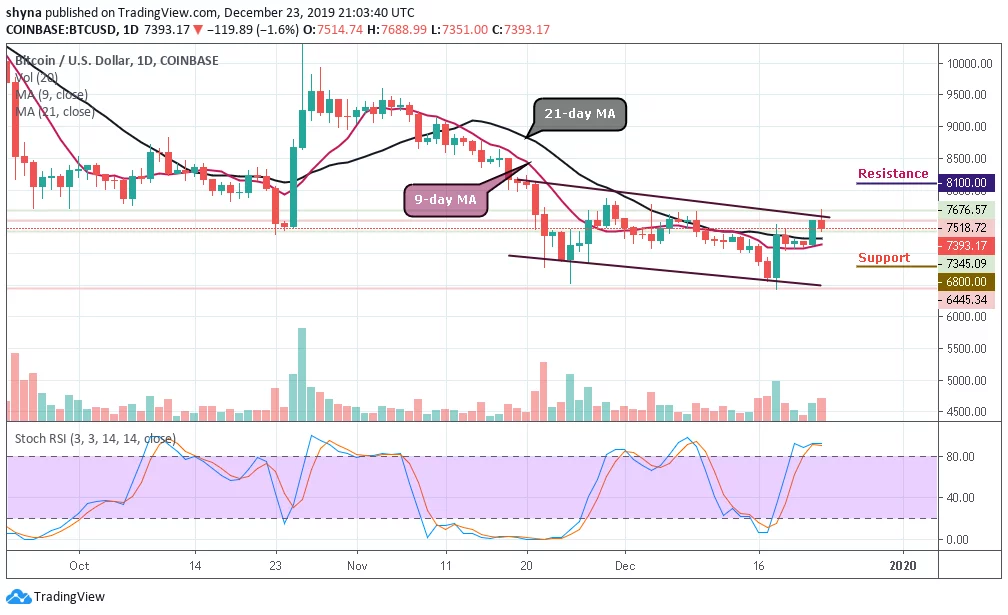
BTC/USD Long-term Trend: Bearish (Daily Chart)
Key levels:
Resistance Levels: $8,100, $8,300, $8,500
Support Levels: $6,800, $6, 600, $6,400

BTC/USD has once again made an impressive move to the upside during the early trading session today but the coin is currently trading below $7,500 after touching the key resistance at $7,676.57. The bulls are now expecting the price to rally higher but the outlook still remains bearish. In order for things to change in the near-term, traders would need to see BTC/USD make a higher high and a higher low to invalidate the current downtrend that is still intact.
More so, if the price ends up doing that, the market would have reason to be bullish not just till $8,000 but even beyond that to $9,000 or higher. However, it is important to note that the potential move to the upside has to be a sustained rally rather than a pump otherwise it would be of little consequence. Despite the recent bullishness in the market, we are yet to see the on-going correction come to completion, whereas, Bitcoin (BTC) bulls are still too optimistic.
Nevertheless, if Bitcoin bulls hold the price to remain above the 9-day and 21-day moving averages; the price could rise above the channel and move to $7,800 vital resistance. A further high drive could send the coin to $8,100, $8,300 and $8,500 resistance levels. Meanwhile, the stochastic RSI is within the overbought zone revealing a sign of trend reversal, which shows a possible bearish momentum, the support levels to watch are $6,800, $6,600 and $6,400 respectively.
BTC/USD Medium – Term Trend: Bullish (4H Chart)
BTC/USD is seen performing well at present. With this, we expect the coin to gain the lost momentum and hit the trade above $7,700. However, the volatility hovers and the selling pressure still exists which leads the coin to lose the major support from the moving averages. Meanwhile, the $7,000 and below may come into play if BTC breaks below $7,200 support level.
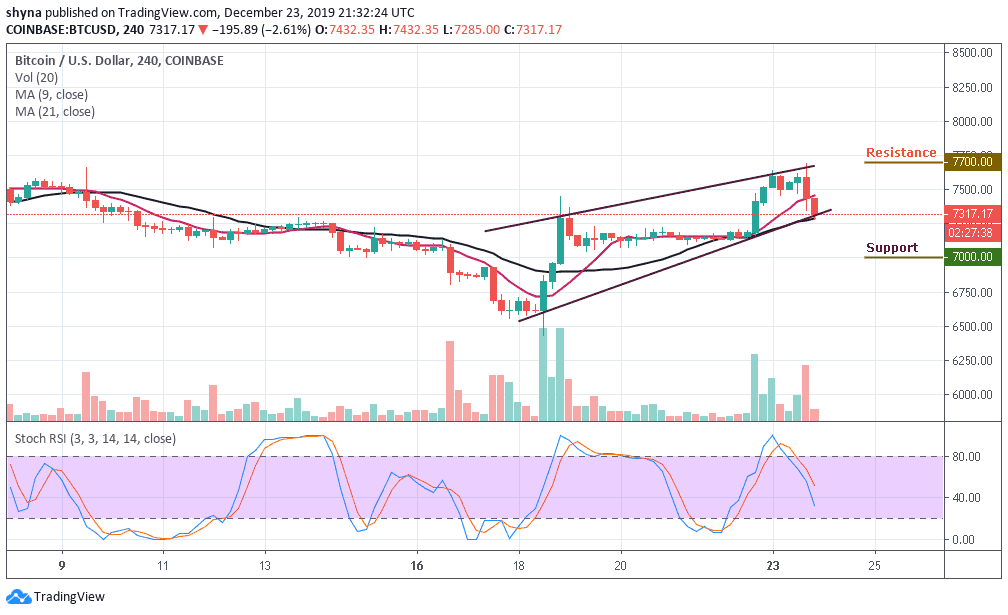
However, in as much as the buyers can reinforce and power the market, traders can expect a retest at $7,600 resistance level and breaking this level may further allow the bulls to reach $7,700 and above. The stochastic RSI is nose-diving toward the 50-level which shows that more bearish signals may surface.
Please note: Insidebitcoins.com is not a financial advisor. Do your research before investing your funds in any financial asset or presented product or event. We are not responsible for your investing results.
Join Our Telegram channel to stay up to date on breaking news coverage