Join Our Telegram channel to stay up to date on breaking news coverage
Bitcoin Price Prediction (BTC) – April 23
BTC/USD reclaimed the big $7,200, however much supply remains within the region.
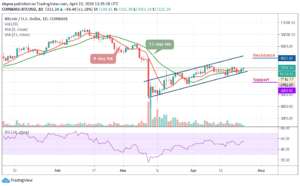
BTC/USD Long-term Trend: Bullish (Daily Chart)
Key levels:
Resistance Levels: $8,000, $8,200 $8,400
Support Levels: $6,000, $5,800, $5,600

The Bitcoin price has continued its upward movement after a brief dip from $7,116 to $6,986 in the early hours of today. Yesterday, BTC/USD hit just over $7,116 where it closed the trading of yesterday. Today, the price of the leading crypto asset is once again heading towards the north, in fact, the coin is currently moving and may likely cross above the price levels seen during April 20 trading.
Meanwhile, on the upside, as the coin trades above the 9-day and 21-day moving averages, little is in place to prevent correction targeting the key resistance of $7,500 as the technical indicator RSI (14) moves above the 55-level. However, BTC/USD is strongly supported at the various former resistance levels include $6,800 and $7,000.
Nevertheless, the coin is also banking on the support at $6,500, $6,300 and $6,100 to ensure that in spite of a reversal, the Bitcoin price stays above $7,500 level. Similarly, the potential resistance levels to watch for are $8,000, $8,200, and $8,400 while the support levels to keep an eye on are $6,000, $5,800, and $5,700 respectively.
BTC/USD Medium-term Trend: Bullish (4H Chart)
The 4-hour chart shows that the price will soon find its way upward as the RSI (14) breaks above 62-level. Although the bears have dominated the market for some days now, it is high time for the bulls to defend the $7,000 support and push the price towards the north.
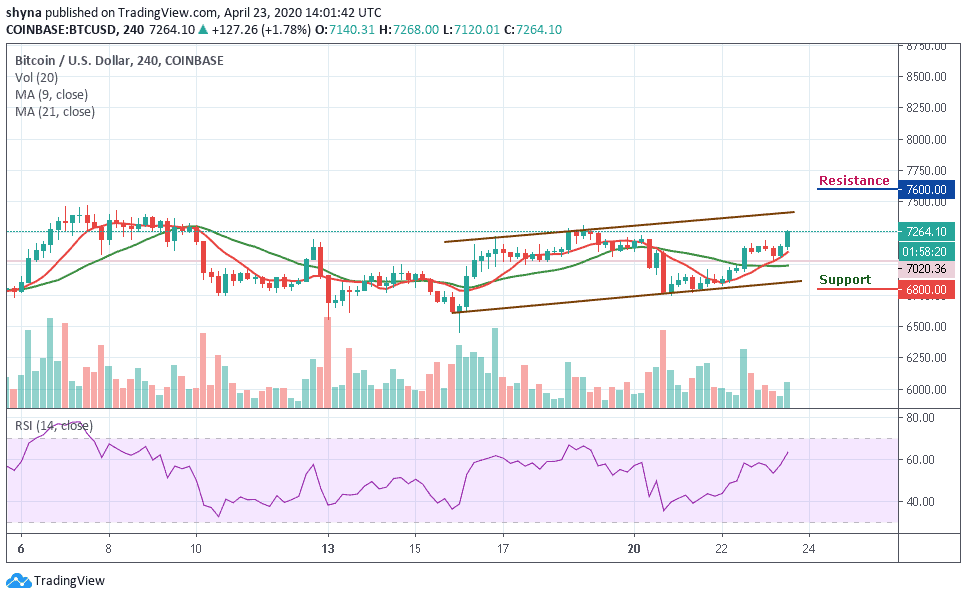
Meanwhile, the support levels of $6,800 and below may come into play if the price breaks below the 9-day and 21-day moving averages within the channel. But in as much as the buyers have enough strength to power the market; they can push the price towards the upper boundary of the channel where it could hit the targeted resistance levels of $7,600 and above.
Please note: Insidebitcoins.com is not a financial advisor. Do your research before investing your funds in any financial asset or presented product or event. We are not responsible for your investing results.
Join Our Telegram channel to stay up to date on breaking news coverage