Join Our Telegram channel to stay up to date on breaking news coverage
Bitcoin (BTC) Price Prediction – July 11
The price of Bitcoin is trading in a tight range between $9,000 and $9,458 since the beginning of this month.
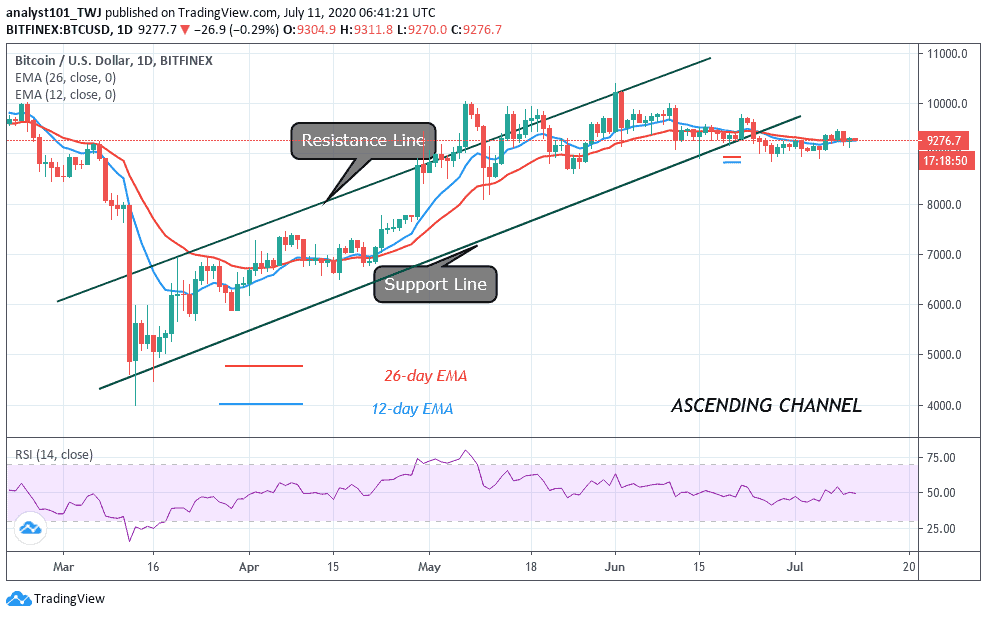
BTC/USD Long-term Trend: Ranging (Daily Chart)
Key levels:
Resistance Levels: $9,700, $9,900, $10,100
Support Levels: $8,800, $8,600, $8,400
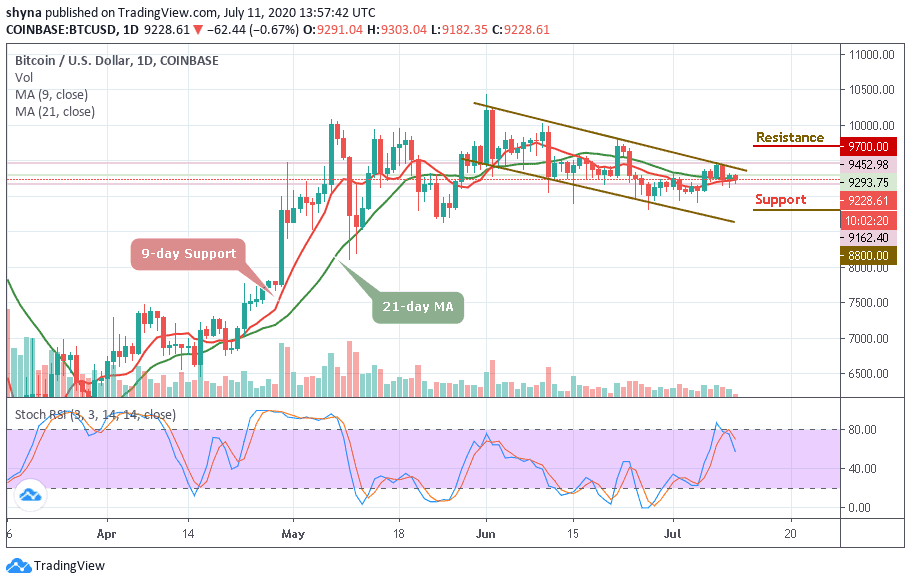
BTC/USD keeps following the downtrend and it is now trading sideways. With the look of things, if BTC/USD continued to consolidate in this way, we could see it moving towards the support of $9,100 and it would then be obvious to target $9,000. More so, we could see a larger decline over the next two days if the downtrend continues to form in a pattern formation.
Meanwhile, the market has remained in the consolidation mode around the 9-day and 21-day moving averages, deciding on the next move. However, it can be expected that the market may continue to sell should in case the declines come together. But, if the bulls show a strong commitment, the price of Bitcoin could rise to the potential resistance levels of $9,700, $9,900, and $10,100. The technical indicator is seen giving fade bearish signal as the signal lines move below 70-level.
Nevertheless, BTC/USD attempted to develop a recovery above the moving averages but failed to break above this barrier. More so, the daily chart reveals that the weak upward momentum affected the Bitcoin bulls, although bears may likely push the price towards $9,000 to increase the chances of a downward scenario which may lead the price to $8,800, $8,600, and $8,400 levels in the next downward period.
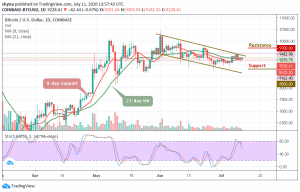
BTC/USD Medium – Term Trend: Ranging (4H Chart)
Bitcoin’s price is still trading around $9,209 after rebounding from $9,179 in today’s trading. Looking at the hourly price chart, we can see that the bearish supply is coming up slowly in the market, but the bulls are also trying to defend the $9,200 supports. Meanwhile, the $9,000 support level and below may come into play if BTC breaks the mentioned support.

However, if the buyers show a strong commitment within the market, we can expect a retest of $9,300 resistance level. Therefore, breaking this resistance level could allow the bulls to test the $9,400 and upward. However, the coin is consolidating currently and moving sideways as the MACD signal lines move to cross into the negative side.
Join Our Telegram channel to stay up to date on breaking news coverage