Join Our Telegram channel to stay up to date on breaking news coverage
Bitcoin Price Prediction – March 1
The Bitcoin price prediction shows that BTC touches the resistance level of $44,000 as the recovery comes gradually.
BTC/USD Long-term Trend: Bearish (Daily Chart)
Key levels:
Resistance Levels: $49,000, $51,000, $53,000
Support Levels: $35,000, $33,000, $31,000
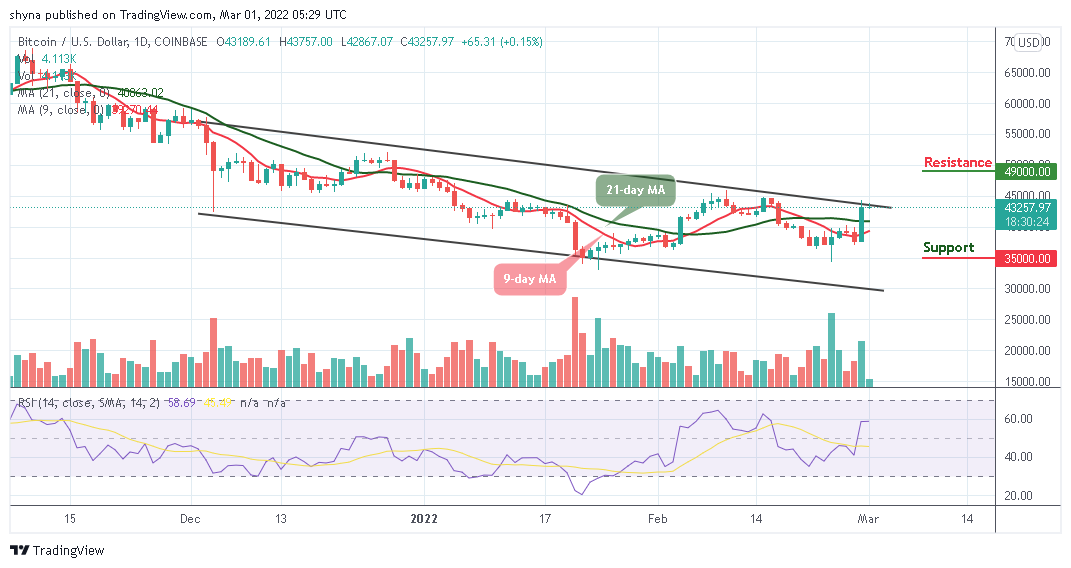
At the time of writing, BTC/USD is seen trading at $43,257 after soaring above the 9-day MA and 21-day moving averages to cross the upper boundary of the channel. The first digital asset is also seen pulling back after touching the daily high of $43,757 during the European session today and may likely head downwards if the bears step back into the market.
Bitcoin Price Prediction: Bitcoin (BTC) May Range-bound
As revealed by the daily chart, it is imperious for the Bitcoin price to remains above the 9-day and 21-day moving averages, otherwise, there may come a bearish breakdown when BTCUSD falls below that barrier. At the time of writing, the red-line of the 9-day moving averages and the green-line of the 21-day moving average are about to cross each other as the technical indicator Relative Strength Index (14) prepares to cross above 60-level.
However, BTC/USD will confirm the bullish trend if the market price moves above $45,000. Meanwhile, the Bitcoin price may follow the bearish trend if the price moves back below the moving averages and face the lower boundary of the channel. Should this happen, the king coin may drop to the critical supports of $35,000, $33,000, and $31,000. Otherwise, a strong bullish spike may push the price towards the resistance levels of $49,000, $51,000, and $53,000.
BTC/USD Medium-Term Trend: Ranging (4H Chart)
Looking at the 4-hour chart, the Bitcoin price is currently crossing above the upper boundary of the channel. If the price continues to rise further, it could reach the nearest resistance level at $46,500 and above.
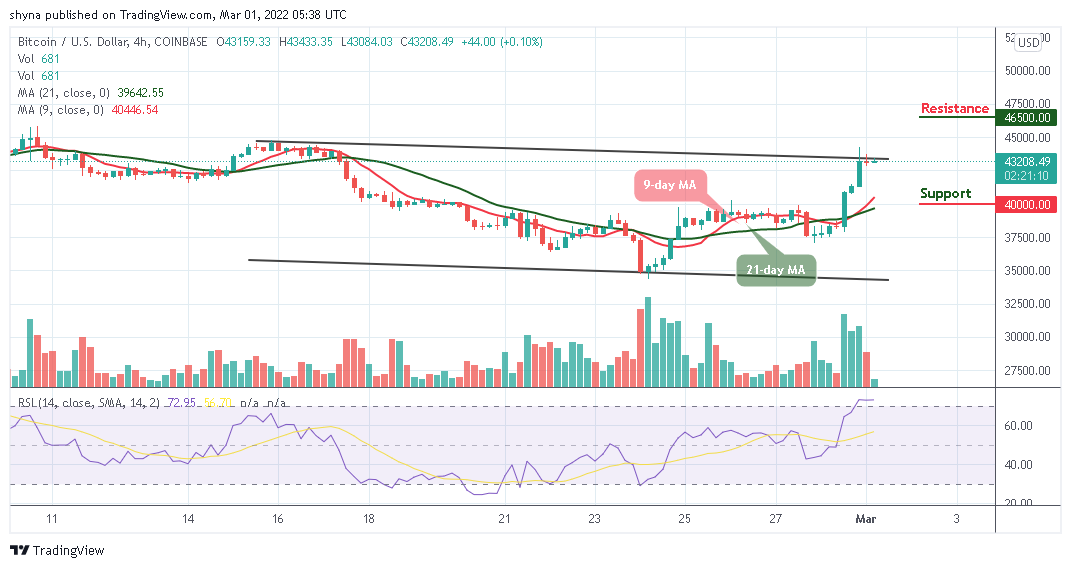
Moreover, if the bears push the coin below the 9-day and 21-day moving averages, BTC/USD may likely reach the closest supports at $40,000 and below. Presently, the technical indicator Relative Strength Index (14) is seen moving within the overbought region, suggesting a sideways movement for the market.
Looking to buy or trade Bitcoin (BTC) now? Invest at eToro!
68% of retail investor accounts lose money when trading CFDs with this provider
Read more:
- How to buy Bitcoin
- How to buy Cryptocurrency
Join Our Telegram channel to stay up to date on breaking news coverage