Join Our Telegram channel to stay up to date on breaking news coverage
Bitcoin (BTC) Price Prediction – October 5, 2020
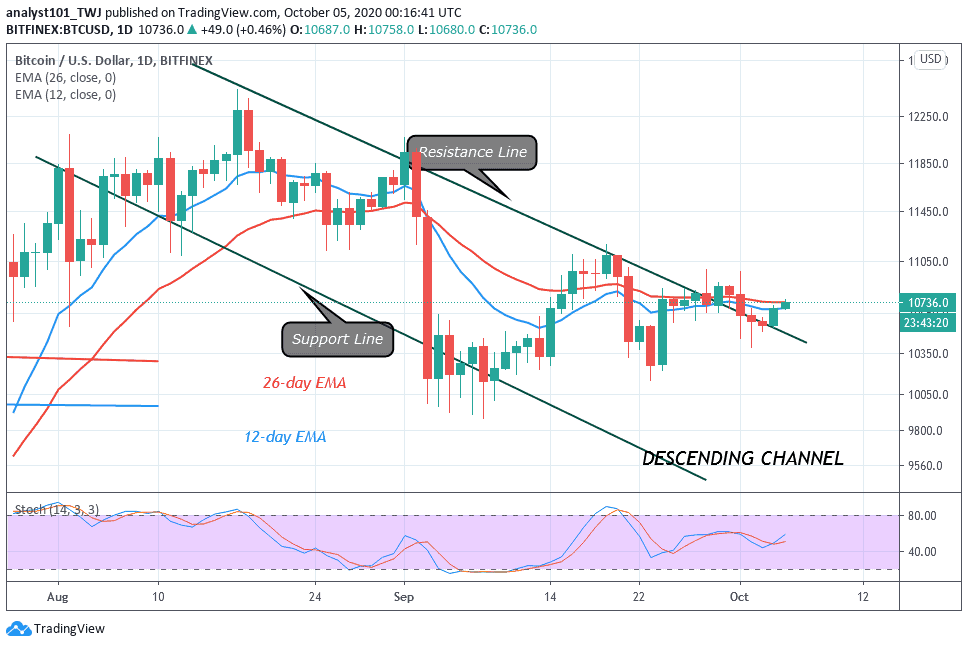
Since September 16, BTC/USD has been trading between $10,000 and $11,100. The bulls have made frantic efforts to break the $11,000 resistance, while the bears attempt the psychological support at $10,000.
Resistance Levels: $10,000, $11, 000, $12,000
Support Levels: $7,000, $6,000, $5,000

Within the period of range-bound movement, the bulls have retested the $11,000 resistance twice but unable to break above it. The selling pressure at the resistance level was more compelling as the coin fell to the middle of price range. Precisely, BTC is trading at $10,674 at the time of writing. As the resistance becomes difficult to break by the bulls, a breakout at $11,000 is unavoidable. A breakout will propel the coin on a price acceleration to $11,800 high.
The chances of retesting the $12,000 and $12,400 overhead resistance become possible. Similarly, BTC price will encounter a breakdown if the support proves a hindrance to the bears. A break down below the $10,000 support will sink the coin to the low above $9,200. Meanwhile, the king coin is trading below the EMAs or in the bearish trend zone.
Bitcoin Technical Indicators Reading
Bitcoin price bars are below the EMAs which is advantageous to the bears. A break above the EMAs will mean an upward movement of the coin. The price has broken above the resistance line of the descending channel. Invariably, it means the coin will rise.

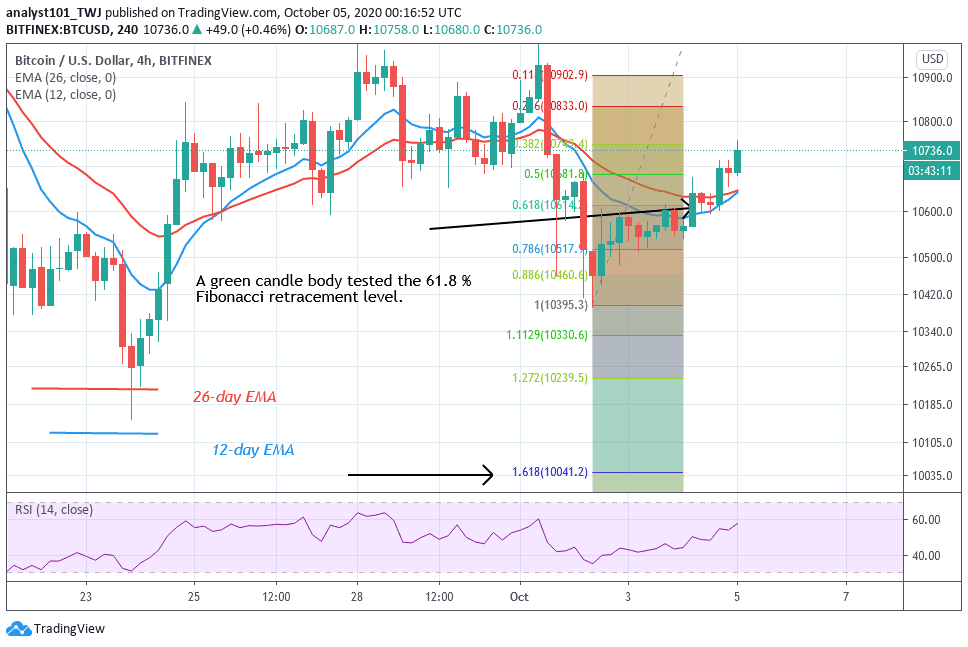
Meanwhile, BTC is making upward correction as it reaches $10,700 high. This time if it plunges it will reach the low above $10,000. From the price action, the retraced candle body tested the 61.8% Fibonacci retracement level. This implies that the coin will fall to the 1.618 Fibonacci extension or the $10,041.20 low.
Join Our Telegram channel to stay up to date on breaking news coverage

