Join Our Telegram channel to stay up to date on breaking news coverage
Bitcoin (BTC) Price Prediction – July 25
BTC/USD is seen getting ready for the push to the long-awaited resistance level of $10,000.
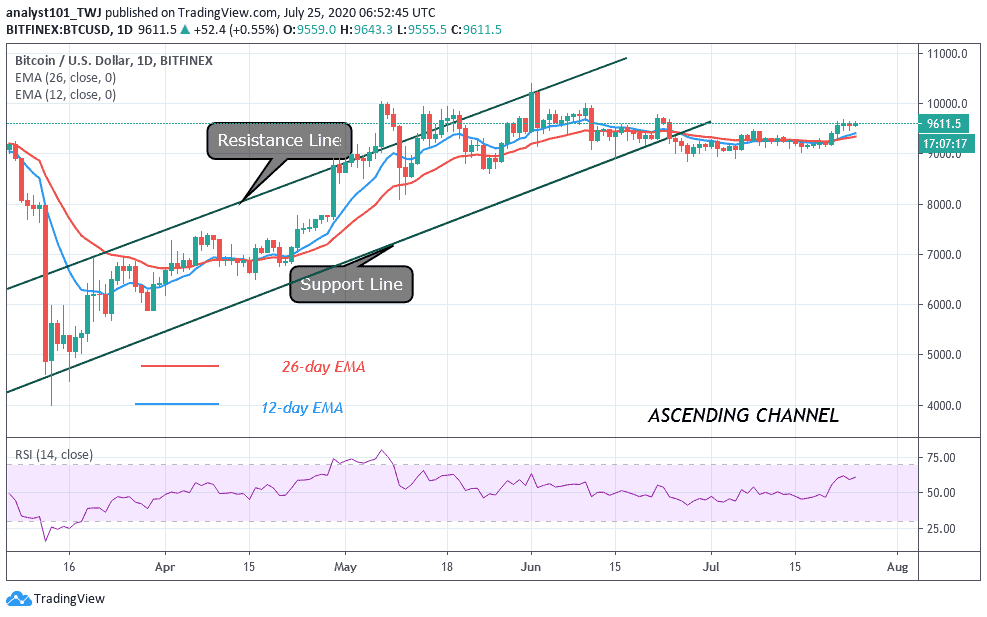
BTC/USD Long-term Trend: Bearish (Daily Chart)
Key levels:
Resistance Levels: $10,000, $10,200, $10,400
Support Levels: $9,200, $9,000, $8,800
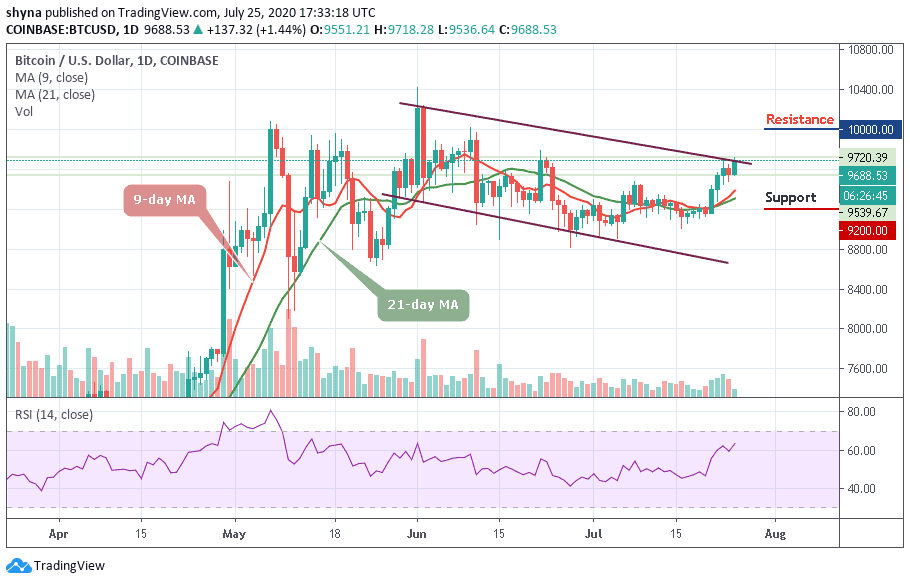
BTC/USD has hit the price area around $9,700 after a few days of despairing trade. The daily chart shows that the coin is currently correcting upwards, we believe that BTC/USD is likely to cross resistances instead of just battling inactive supports. Today, BTC/USD is seen trading at $9,688 after closing at $9,549 yesterday.
However, the coin trades above the upper boundary of the channel today and may continue to head upward if the technical indicator keeps moving above the 60-level. Looking at the daily chart, BTC/USD is now trading above the crucial levels that may now function as the support zones in the event a reversal occurs.
Meanwhile, on the upside, as the coin moves above the 9-day and 21-day moving averages, little is in place to prevent correction targeting the key resistance of $10,000 as long as the technical indicator RSI (14) remains above 60-level.
Nevertheless, the bulls are banking on the support at $9,200, $9,000, and $8,800 to ensure that in spite of a reversal, the Bitcoin price could stay above $9,700 level. Similarly, the nearest resistance levels to keep watching on are $10,000, $10,200, and $10,400 respectively.
BTC/USD Medium – Term Trend: Bullish (4H Chart)
The 4-hour chart for BTC is still looking bullish as the market has been showing a sign of bullish trend since the daily opening. However, intraday trading is still following the upward movement; following the recent rebound at $9,573 which is now a key support level. The next key support levels are $9,500, $9,300, and $9,100.
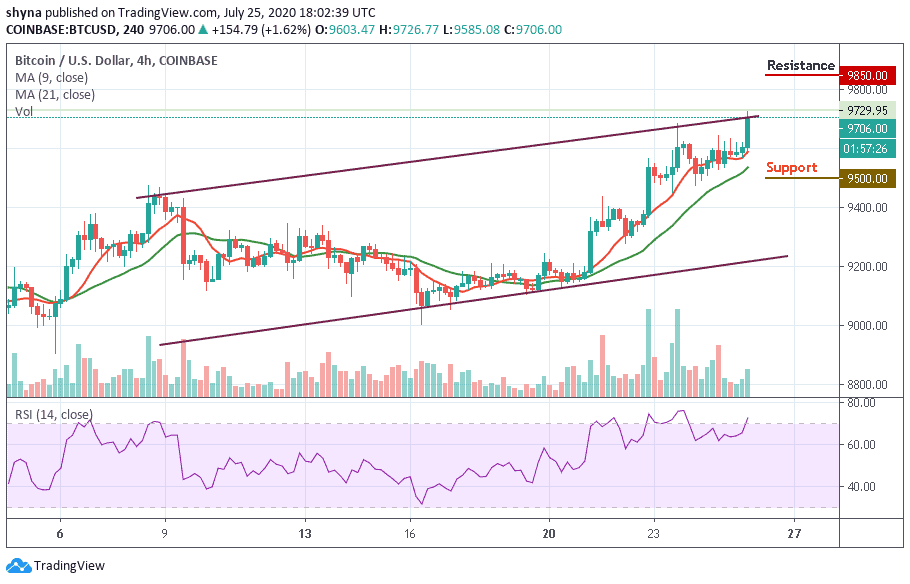
However, considering the recent sharp rebound, the Bitcoin price may continue the bullish rally to $9,800 resistance. A climb above the mentioned resistance may further push the BTC price to $9,850, $10,050, and $10,250 resistance levels. As it is now, it seems the bulls may continue to dominate the market as long the RSI (14) stays within the overbought, suggesting more bullish signals.
Join Our Telegram channel to stay up to date on breaking news coverage