

Join Our Telegram channel to stay up to date on breaking news coverage
Bitcoin (BTC) Price Prediction – May 29
The Bitcoin bears stepped in after two huge bullish days as the technical indicator shows decreasing market momentum.
BTC/USD Long-term Trend: Bullish (Daily Chart)
Key levels:
Resistance Levels: $10,600, $10,800, $11,000
Support Levels: $8,200, $8,000, $7,800
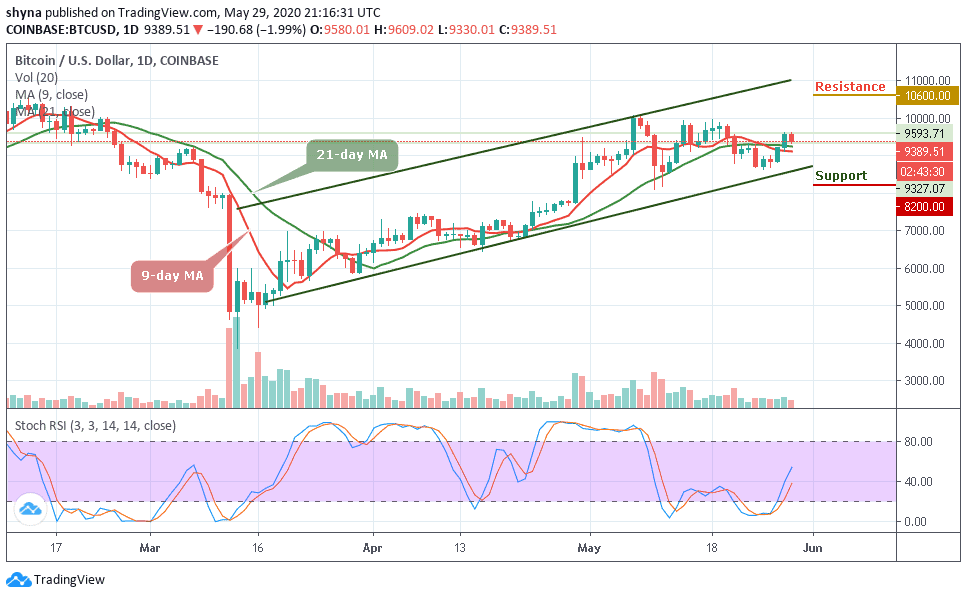
BTC/USD bears have been taking control since the early hours of today as the price drops from $9,593 to $9,327. Currently, the Bitcoin (BTC) is under consolidation from yesterday’s move but the bulls seem to be comfortable. The 9-day and 21-day moving averages may serve as support as the bulls are looking to set a higher low.
However, if BTC/USD were to break the lower high, traders should expect to see an enormous continuation afterward but right now, we couldn’t know if Bitcoin is actually going to break this level or not. Meanwhile, the Bitcoin price is currently closer to the lower high than it is to the higher low but we can easily see another lower high formed followed by a higher low. Nevertheless, if the price of Bitcoin drops below the moving averages, we should expect long-term support at the $8,800.
More so, any further bearish movement may lead to the support levels of $8,200, $8,000 and $7,800 as the technical indicator shows decreasing market momentum. In other words, the $9,600 and $9,800 level may further surface as potential resistance levels if the $9,400 level holds. However, a strong bullish movement might take it to $10,600, $10,800, and $11,000 levels.
BTC/USD Medium-Term Trend: Bullish (4H Chart)
Looking at the 4-hour chart, after the crypto faced a long period of upward movement within its previously established trading, Bitcoin bears are still making an attempt to step back into the market pushing the BTC price below its previous price level that existed around $9,200 to $9,100 as the Bitcoin price has not yet slipped below $9,000.
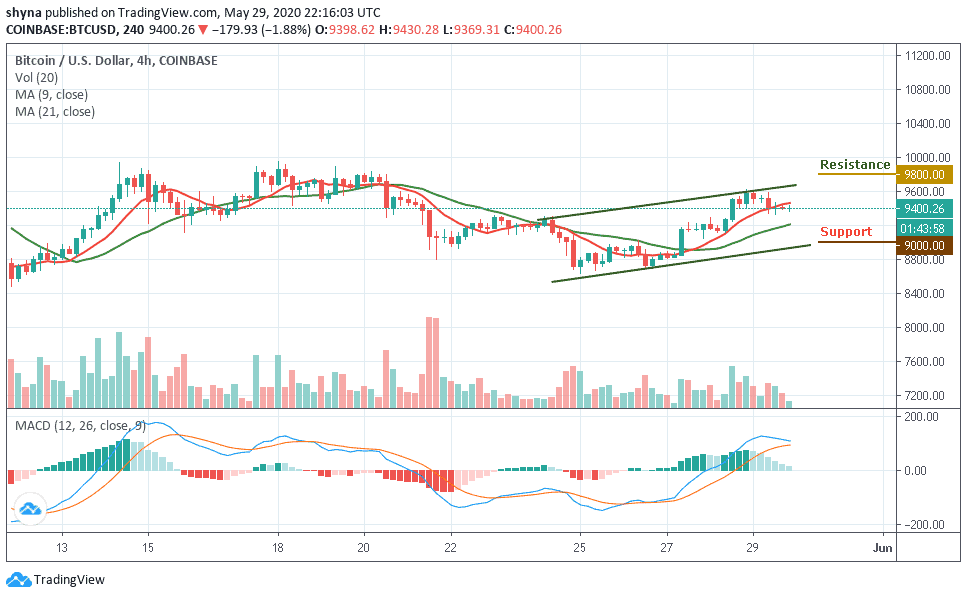
In addition, BTC/USD is currently moving within the channel but below the 9-day moving average. The upward movement may continue to push the price across the upper boundary of the channel and to the nearest resistance at $9,800, $10,000, and $10,200 levels while the immediate and critical support lies at $9,000, $8,800 and $8,600. The MACD signals lines have crossed into the positive side, suggesting bullish signals.
Please note: Insidebitcoins.com is not a financial advisor. Do your research before investing your funds in any financial asset or presented product or event. We are not responsible for your investing results.
Join Our Telegram channel to stay up to date on breaking news coverage