Join Our Telegram channel to stay up to date on breaking news coverage
Bitcoin Price Prediction – May 31
The present downward movement in the market shows BTC/USD struggling to find support around a lower trading zone below the level of $35,000. Since a couple of days’ sessions back, the top crypto has continually hovered around that level to now trade at a point of $36,744, for a 1.23% improvement.
BTC/USD Market
Key Levels:
Resistance levels: $40,000, $45,000, $50,000
Support levels: $30,000, $25,000, $20,000
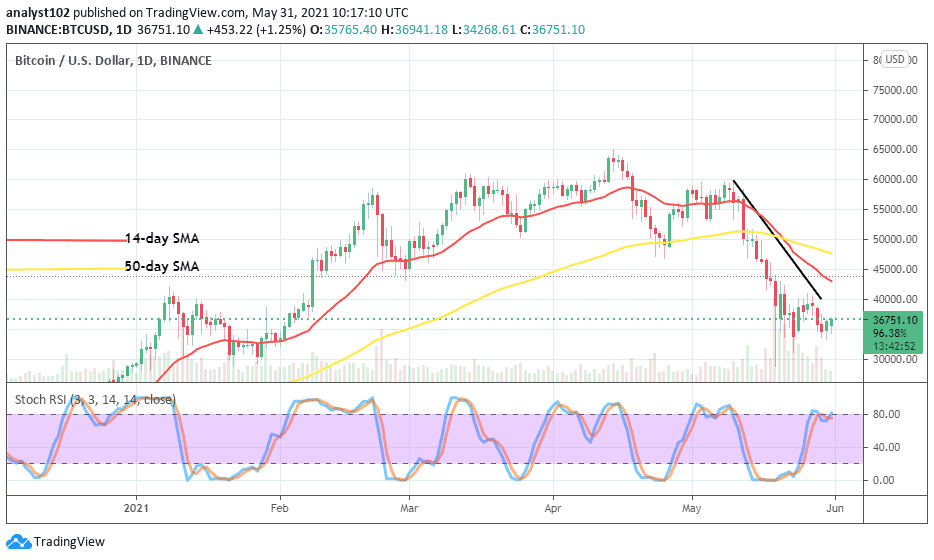
Bitcoin price prediction: BTC/USD – Daily Chart
A variant featuring candlesticks has been made on the BTC/USD daily chart to show the BTC/USD struggles to find support deep below the major resistance value of $40,000. The bearish trend-line remains drawn downward to place a mark at the point mentioned earlier.
The 50-day SMA indicator is situated over the 14-day SMA. And, they both point toward the south. The Stochastic Oscillators have moved upward from the oversold region to position around range 80 nearing into the overbought region. That suggests that the chief crypto is less active in the pushes against the fiat counter trading instrument as of writing.
BTC/USD struggles finding support, how soon will it swing high?
The main point that the BTC/USD price struggles finding support has technically been observed at the level of $35,000. Some falling forces have featured in the crypto market operations below the immediate resistance line of $40,000 only to allow Bitcoin to rebuild its energy from a lower area.
As a result of the current trading style, a point in between the point earlier mentioned and the lower level of $30,000 has been the major area where bulls regain their lost capacity.
Up till the present technical downside analysis of this crypto market bears still have a lot to do between the points of $40,000 and $35,000.
At the moment there is a bullish engulfing candlestick formed against the $40,000 resistance line, then, the potential of having back a continual series of upswings will be more heightened than having downswings afterward. But, in the meantime, that sentiment seems not achievable in a near trading operation.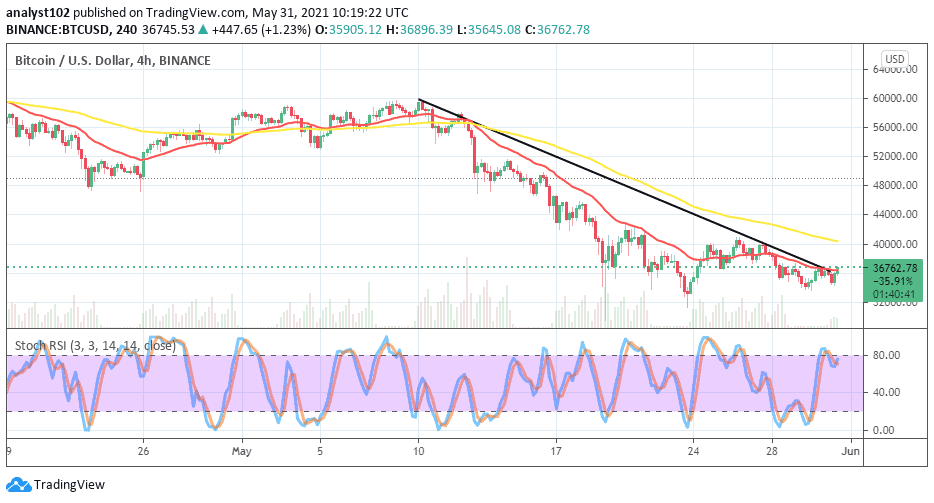
BTC/USD 4-hour Chart
The market trend on the BTC/USD chart still showcases that the market valuation trades under selling pressure. The bearish trend-line drew closely along with the smaller SMA. The 50-day SMA indicator is yet located above the 14-day SMA trend-line.
The Stochastic Oscillators have sprung up from the oversold region to now attempt a move towards the north, at range 80. That shows that bulls are attempting to make a re-launch of their position in the market. Therefore, traders are enjoined to enter a buy order when price goes dip. Like wisely, investors may consider joining the crypto economy now that it is at a lower point than most of the previous higher values it achieved.
Looking to buy or trade Bitcoin (BTC) now? Invest at eToro!
75% of retail investor accounts lose money when trading CFDs with this provider
Join Our Telegram channel to stay up to date on breaking news coverage