Join Our Telegram channel to stay up to date on breaking news coverage
Bitcoin (BTC) Price Prediction – May 23
The Bitcoin price looks shaky after dropping below $9,300 support but still remains within the ascending channel.
BTC/USD Long-term Trend: Bullish (Daily Chart)
Key levels:
Resistance Levels: $10,600, $10,800, $11,000
Support Levels: $7,800, $7,600, $7,400
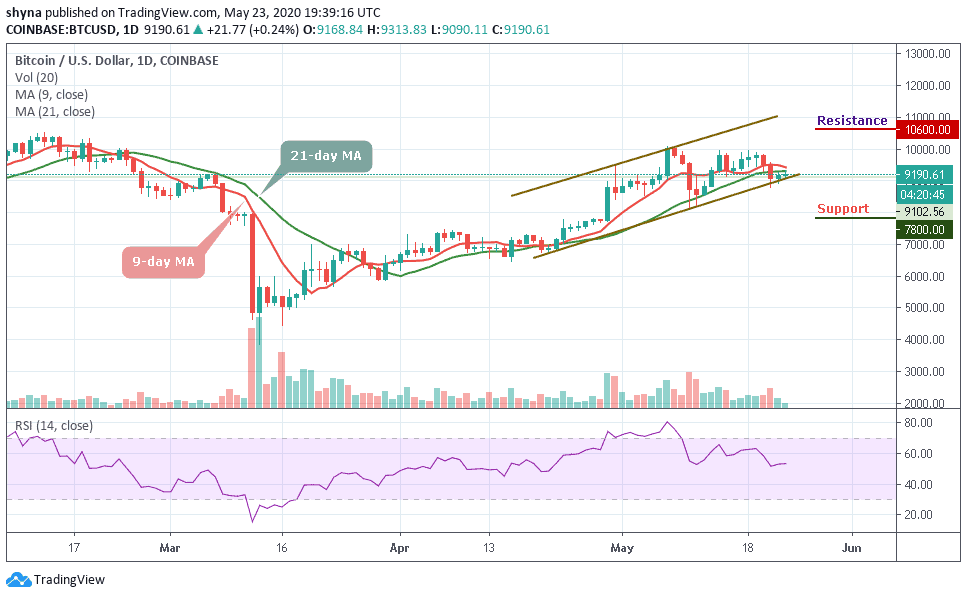
BTC/USD is currently trading below the resistance zone. Looking at the daily chart, the price action is indicating a small candlestick like Doji and a spinning top. More so, this candlestick indicates that buyers and sellers are exhausted and undecided about the direction of the market. The technical indicator RSI (14) is moving around 53.54-level and this indicates that the coin is still in an uptrend zone and the bulls are in control.
In another perspective, BTC/USD might face a setback for now and this is not going to be a permanent one. But the coin is likely to have a bullish run in the short-term while a price rally may help the coin to touch its monthly high. Currently, Bitcoin is trading around $9,190 level below the 9-day and 21-day moving averages after a fall from $9,291 in the early hours of today. A further drop may cause the coin to fall more but a buying pressure may visit the market soon.
Nevertheless, if critical support of $9,000 can continue to provide support for the market, traders may expect the Bitcoin price to come back to a resistance level of $9,300 before the market experience a rise far above the moving averages to reach the potential resistance levels at $10,600, $10,800 and $11,000 respectively. Meanwhile, any bearish movement below the channel may likely drag the market towards the support levels of $7,800, $7,600 and $7,400.
BTC/USD Medium-Term Trend: Bullish (4H Chart)
On the 4-hour chart, the Bitcoin price needs to climb $9,300 above the moving averages within the channel to mitigate the short-term bearish pressure and allow for an extended recovery towards $9,500. Meanwhile, the bullish movement may likely push the coin towards the resistance levels of $9,600 and $9,800.
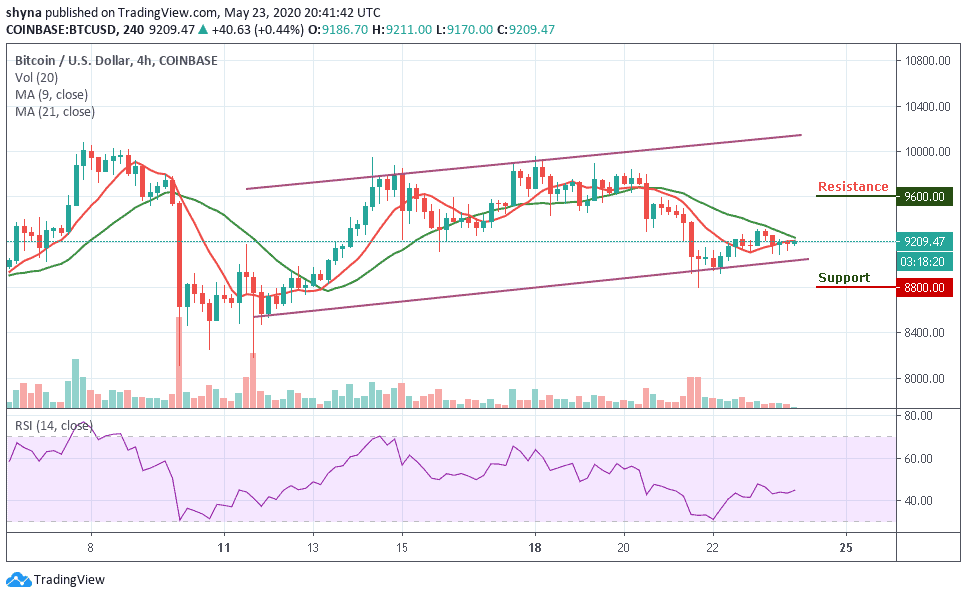
Conversely, any bearish movement below the lower boundary of the channel may increase the downside pressure and push the price towards $8,800 and $8,600 support levels. More so, the RSI (14) is moving above the 45-level, suggesting more bullish signals into the market.
Please note: Insidebitcoins.com is not a financial advisor. Do your research before investing your funds in any financial asset or presented product or event. We are not responsible for your investing results.
Join Our Telegram channel to stay up to date on breaking news coverage