Join Our Telegram channel to stay up to date on breaking news coverage
Bitcoin (BTC) Price Prediction – June 21
The daily chart of Bitcoin (BTC) shows harsh pullback today and has affected the majority of altcoins within the market.
BTC/USD Long-term Trend: Ranging (Daily Chart)
Key levels:
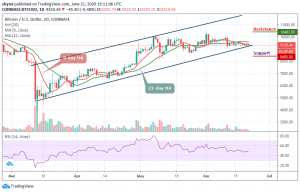
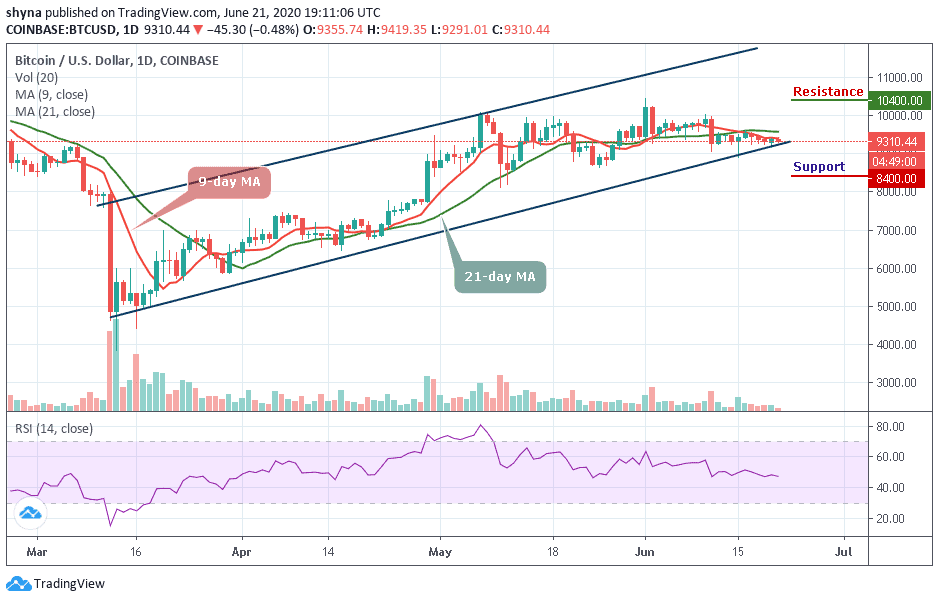
Resistance Levels: $10,400, $10600, $10,800
Support Levels: $8,400, $8,200, $8,000
BTC/USD is putting the traders under a nail-biting situation as the coin keeps heading downwards till just now. From its pulled-back price level of $9,280, BTC price is yet to bounce up to $9,500. The coin touched the daily high of $9,426 when the day opens, and the price correction is driving the coin below $9,300. Such notable price decline has triggered doubts amongst the crypto community as the decline has affected other coins within the market.
Moreover, the coin is trading at $9,310 and displays an intraday loss of 0.48%. The prevailing trend is still ranging from expanding volatility. The leader of cryptocurrencies currently consolidates in a bullish flag pattern. Meanwhile, a breakout from this pattern is supposed to continue in the direction of the previous trend. In this case, traders expect BTC/USD to rise above $9,800 resistance and could move towards the potential resistance levels at $10,400, $10,600, and $10,800.
However, should Bitcoin price failed to move above the 9-day and 21-day moving averages; the price could drop below the lower boundary of the channel. A further low drive could send the price to $8,400, $8,200, and $8,000 support. The technical indicator RSI (14) is revealing a sign of trend reversal, which shows a possible bearish momentum.
BTC/USD Medium – Term Trend: Bearish (4H Chart)
Looking at the 4-hour chart, the bears are seen dominating the market tremendously, but the bulls are trying to defend the $9,300 support as well. Meanwhile, the $9,100 and below may come into play if BTC breaks below the mentioned support.

But if the buyers can reinforce and power the market, traders can expect a retest at $9,400 resistance level, and breaking this level may further allow the bulls to reach $9,600 and above. The RSI (14) crosses below the 45-level which indicates that more bearish signals may play out.
Join Our Telegram channel to stay up to date on breaking news coverage