Join Our Telegram channel to stay up to date on breaking news coverage
Bitcoin (BTC) Price Prediction – July 7
The Bitcoin price is seen declining below $9,300 and it may be vulnerable for a bigger correction.
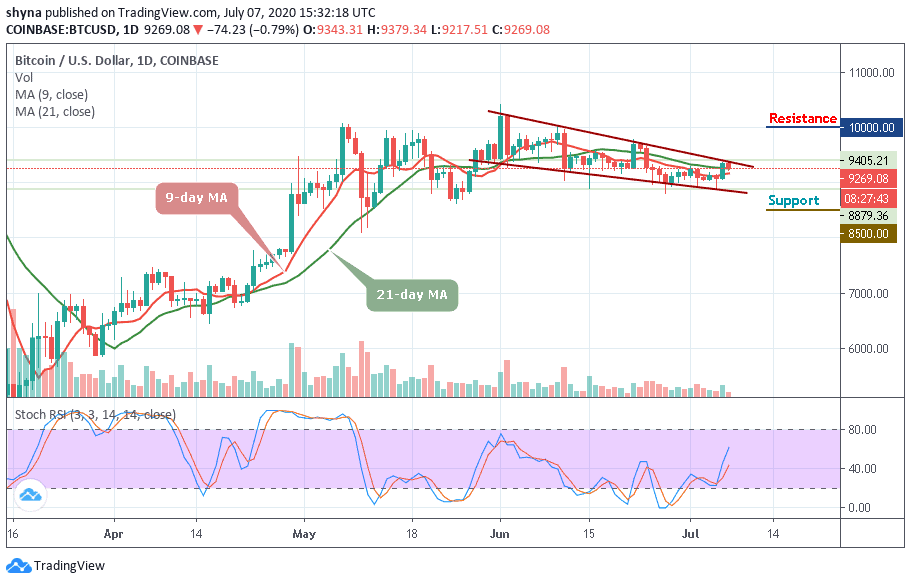
BTC/USD Long-term Trend: Bearish (Daily Chart)
Key levels:
Resistance Levels: $10,000, $10,200, $10,400
Support Levels: $8,500, $8,300, $8,100
BTC/USD is seeing a sudden sell after yesterday’s gains as it dropped from a high of $9,405 to as low as $9,223. Though the coin is attempting to bounce back, the recent drop is pushing the momentum within the bearish favor and this could be the start of a further retracement lower.
Looking at the daily chart, we can see that Bitcoin rolled over from the $9,368 resistance level as it started its descent lower. It is about to drop beneath the 21-day moving average at $9,278 but manages to find support around the 9-day moving average at $9,150 which may allow it to bounce back higher.
However, if the sellers continue to drag the coin back beneath the support at $9,223, the first level of lower support is located at $9,000. Beneath this, the critical support lies at $8,500, $8,300, and $8,100. On the other hand, if the bulls bounce higher, the nearest resistance lies at $10,000, $10,200 and $10,400 levels.
Meanwhile, the stochastic RSI is moving above the 40-level which shows that the market may still follow an upward movement for a market recovery.
BTC/USD Medium – Term Trend: Ranging (4H Chart)
Since the beginning of today, BTC/USD has been trading within the range of $9,378 to $9,218 been revealed by the technical indicator RSI (14). Nevertheless, the coin has not yet slipped below $9,200 but still in the loop of making a bounce back. The Bitcoin price is changing hands at $9,271 and may take time to persistently trade above $9,400.
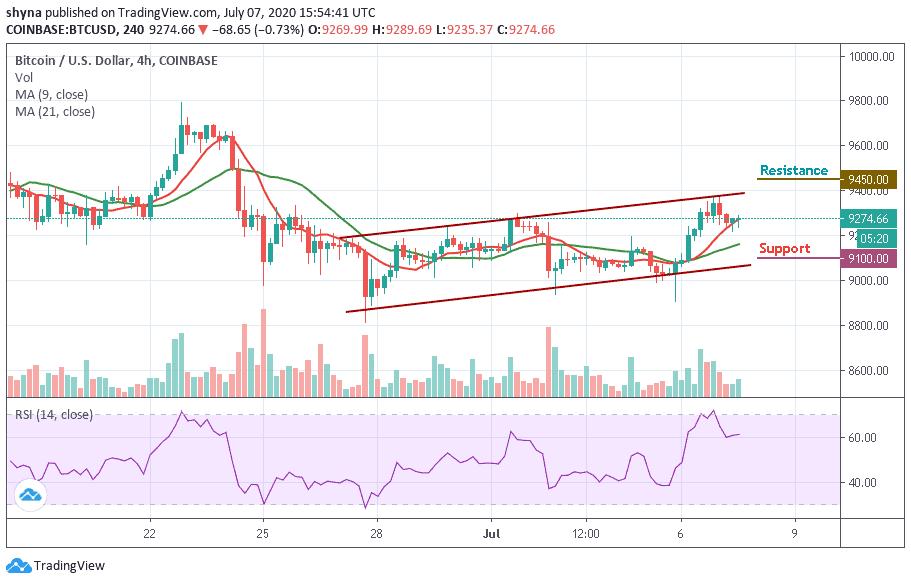
However, the upward movement is facing hurdles near the $9,450 and $10,550 resistance level. However, on the downside, immediate support is near the $9,200 level while the price might slide sharply below $9,150 which may likely test the main support at $9,100 level and below.
Join Our Telegram channel to stay up to date on breaking news coverage