Join Our Telegram channel to stay up to date on breaking news coverage
Bitcoin (BTC) Price Prediction – February 10
BTC/USD slides below $10,000 after a day-long of acceptable bullish bias as the coin trades around $9,800.
BTC/USD Long-term Trend: Bullish (Daily Chart)
Key levels:
Resistance Levels: $10,800, $11,000, $11,200
Support Levels: $9,200, $9,000, $8,800
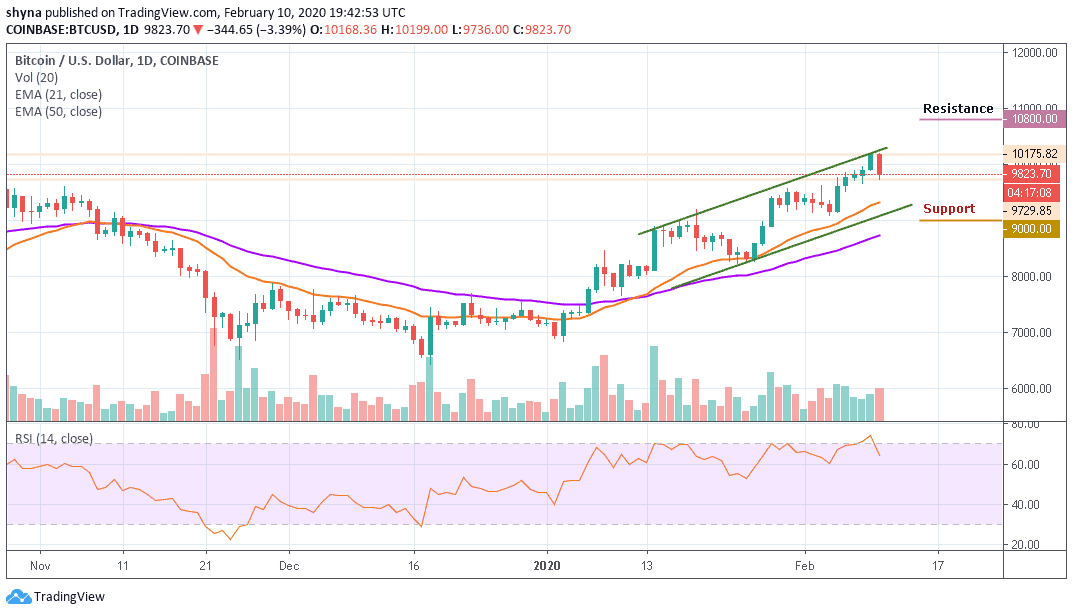
BTC/USD dropped below $10,000 during the early Asian hours of trading but the coin failed to recover above the critical level so far. At the time of writing, the price of Bitcoin is moving around $9,823 as the coin is down with 3.39% within 24 hours. The number one cryptocurrency hit a brick wall on the approach to $10,200 and dropped under the pivotal area in a matter of hours.
However, an upside break above the channel around $10,400 is a must to start a substantial recovery. Meanwhile, the next hurdles may be seen near the resistance levels of $10,800, $11,000 and $11,200. On the downside, initial support is near the 21 periods EMA at $9,300 level and if there is a successful break below the support level of $9,100, the bears are likely to gain strength by bringing the price to a low of $9,000, $8,800 and $8,600 respectively.
Currently, Bitcoin price follows a dominant bearish bias and a glance at the technical indicator RSI (14) displays a negative picture for BTC in the near-term. In addition, maintaining a gradual downward trend in the negative region, the signal line of RSI (14) decreases as it faces a downward trend for an increase in selling entries.
BTC/USD Medium – Term Trend: Bullish (4H Chart)
Looking at the 4-hour chart, Bitcoin’s price is currently trading around $9,861 and below the 21 periods EMA after falling from $10,205 where the coin touched today. Whereas, traders can see that the bullish supply is coming up slightly in the market while the sellers are also trying to drag the price down.
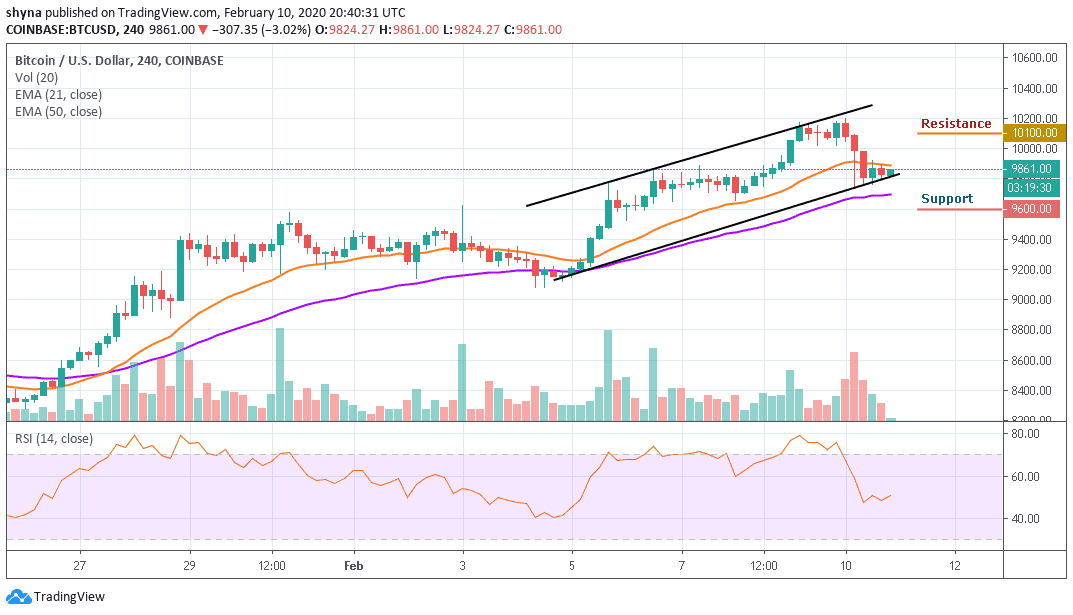
Moreover, in as much as the buyers can strengthen and energize the market, they can further push the price back to a $10,000 resistance level. Therefore, breaking the mentioned resistance could also allow the bulls to test the $10,100 and above. Meanwhile, the market is indecisive as the RSI (14) indicator moves below the 50-level, but any further movement below the lower boundary of the channel may reach the support level of $9,600 and below.
Please note: Insidebitcoins.com is not a financial advisor. Do your research before investing your funds in any financial asset or presented product or event. We are not responsible for your investing results.
Join Our Telegram channel to stay up to date on breaking news coverage