Join Our Telegram channel to stay up to date on breaking news coverage
Bitcoin (BTC) Price Prediction – March 8
Despite the strength seen earlier last week, Bitcoin started to plunge yesterday and as of now, it has dropped to a low of under $8,300.
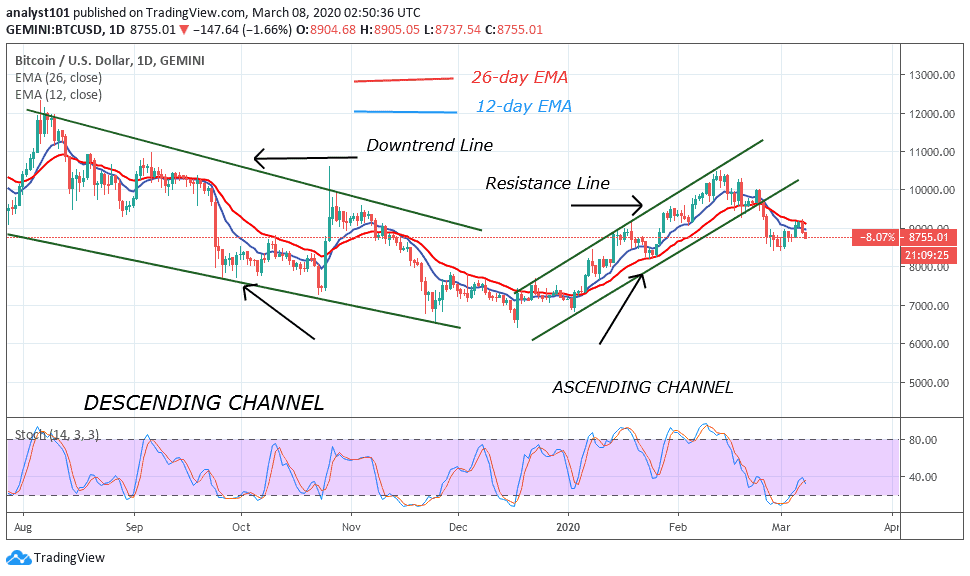
BTC/USD Long-term Trend: Bullish (Daily Chart)
Key levels:
Resistance Levels: $9,500, $10,000, $10,500
Support Levels: $7,500, $7,000, $6,500

After printing a bearish candle that resulted in a crucial reversal at $9,200, BTC/USD has trended lower and lower, falling as low as $8,226 just minutes ago as of the time of writing this article. This marks a nearly 7.62% drop from where it started trading at $8,900. This decision took place in three stages: the first, which brought the coin from $9,200 to $8,900, occurred yesterday’s afternoon.
However, the second, which came around midnight took its price from $8,900 to $8,700, and the latest and most recent occurred in the past three hours. In the time since visiting these lows, the benchmark cryptocurrency has been able to bounce, suggesting that there is support in this region. Looking at the daily chart, BTC/USD is seen trading under the 9-day and 21-day moving averages.
Meanwhile, if there is upsides break, the price is likely to accelerate above $8,500 and $9,000 levels. The next key resistance is near the $9,500, $10,000 and $10,500 levels. On the downside, there are three extremely strong support levels at $7,500, $7,000 and $6,500. The technical indicator RSI (14) still moves below 37-level, which indicates more bearish signals.
BTC/USD Medium – Term Trend: Bearish (4H Chart)
On the 4-hour chart, the unsuccessful attempt to complete the leg above $9,200 must-have demoralized the bulls and left them defenseless. They used all the fights they had to defend $9,000 in the last two days. However, the increased sales activity due to the energetic spirit of the bears sent Bitcoin below $9,000 level. The closest resistance levels lie at $8,700 and $8,900, while the nearest supports are $7,700 and $7,500 respectively.
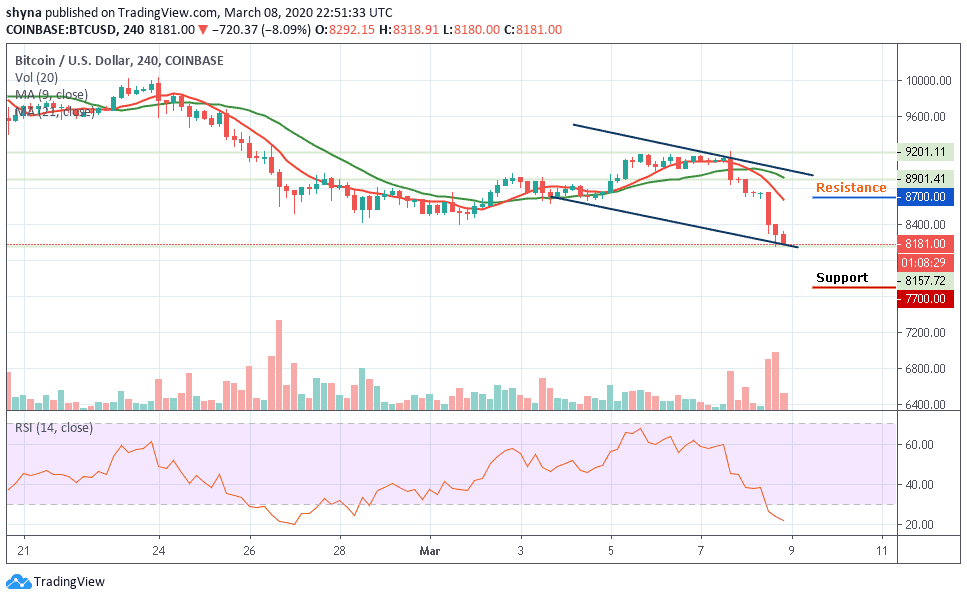
The technical indicators are strongly bearish and are still flashing sell signals. The RSI (14) is buried deep in the oversold, which suggests that bear dominance may likely stay longer. On the contrary, the green-line of 21-day MA is moving above the red-line of 9-day MA, which could mean that BTC/USD is still bearish and a delayed-reversal is on the point.
Please note: Insidebitcoins.com is not a financial advisor. Do your research before investing your funds in any financial asset or presented product or event. We are not responsible for your investing results.
Join Our Telegram channel to stay up to date on breaking news coverage