Join Our Telegram channel to stay up to date on breaking news coverage
Bitcoin (BTC) Price Prediction – February 19
BTC/USD may be heading back for another purposeful retest of the barrier at $10,500.
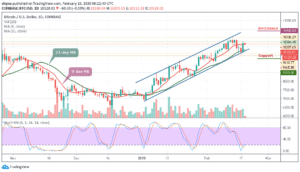
BTC/USD Long-term Trend: Bullish (Daily Chart)
Key levels:
Resistance Levels: $10,900, $11,100, $11,300
Support Levels: $9,300, $9,100, $8,900

The BTC/USD has started a strong increase above $9,700 and $10,000 and it is currently consolidating, which could soon rise above $10,200 for the next bullish move. Yesterday, we saw a new weekly low at $9,610. Later, the Bitcoin price started a decent upward move above the $9,700 and $9,800 resistance level. The bulls gained pace above the 21-day moving average, $10,000, and later crossed above the 9-day moving average. As a result of this, the price traded towards the $10,300 level and a new intraday high was formed near $10,304.45.
Moreover, as the market opens today, BTC/USD started correcting lower below $10,200. However, there are many supports on the downside near $10,100 and $10,000. On the upside, the $10,200 level is a key hurdle for Bitcoin. Therefore, the price must settle above the $10,200 resistance level to continue higher in the near term. In the mentioned case, the bulls are likely to aim a break above the main $10,500 resistance level. If they succeed, the price could even hit the $10,900, $11,100 and $11,300 resistance levels in the near term.
In other words, if the coin fails to surpass the $10,200 resistance level and remain below the 9-day and 21-day moving averages, as the stochastic RSI stays within the oversold zone, BTC/USD could resume its decline and the first major support is near the $10,000 level while the next one is near the $9,700 level. The last line of defense is around the $9,500 level below the 21-day MA. Any further losses might open the doors for a larger downward move towards the $9,300, $9,100 and $8,900 support levels.
BTC/USD Medium – Term Trend: Bearish (4H Chart)
Bitcoin’s price is now above the 9-day and 21-day moving averages trading around $10,092 after rebounding from $6,679 in yesterday’s trading. Looking at the 4-hour price chart, we can see that the bearish supply is coming back slowly in the market, but the bulls are also trying to defend the $9,900 support. Meanwhile, the $9,800 support level and below may come into play if BTC breaks the above-mentioned support.
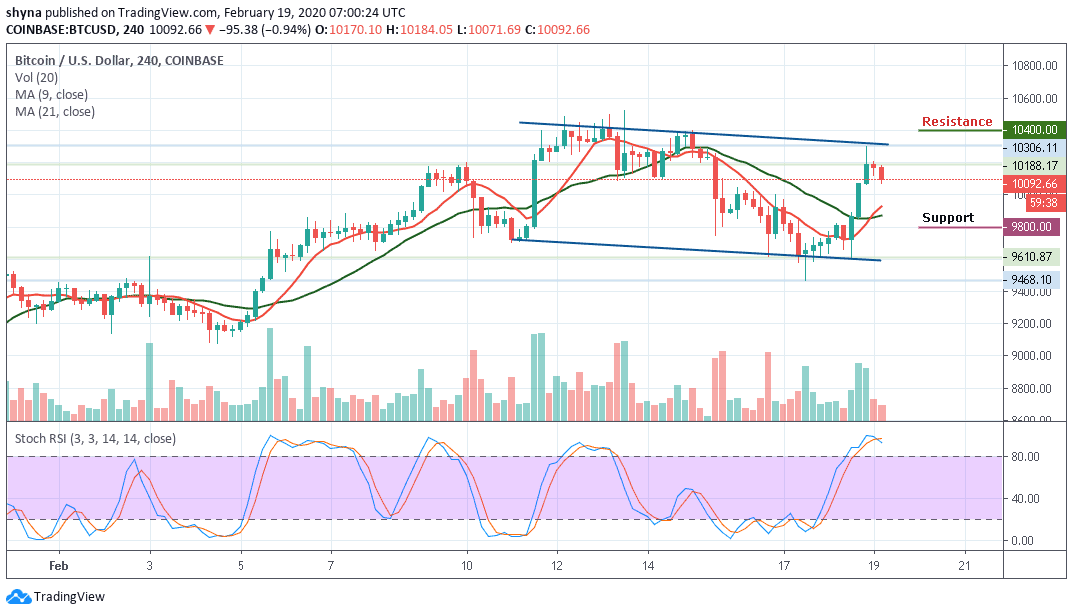
However, if buyers can strengthen and energize the market, we can expect a retest of $10,300 resistance level. Therefore, breaking the mentioned resistance could also allow the bulls to hit the $10,400 and above. However, the stochastic RSI is within the overbought territory, we may expect more bearish signals in the market soon.
Please note: Insidebitcoins.com is not a financial advisor. Do your research before investing your funds in any financial asset or presented product or event. We are not responsible for your investing results.
Join Our Telegram channel to stay up to date on breaking news coverage