Join Our Telegram channel to stay up to date on breaking news coverage
Bitcoin (BTC) Price Prediction – January 15
BTC/USD rests above $8,600 after the retreat from levels $8,892. Further downside momentum appears to be imminent but $8,400 may likely come out as support.
BTC/USD Long-term Trend: Bullish (Daily Chart)
Key levels:
Resistance Levels: $9,300, $9,500, $9,700
Support Levels: $8,000, $7,800, $7,600
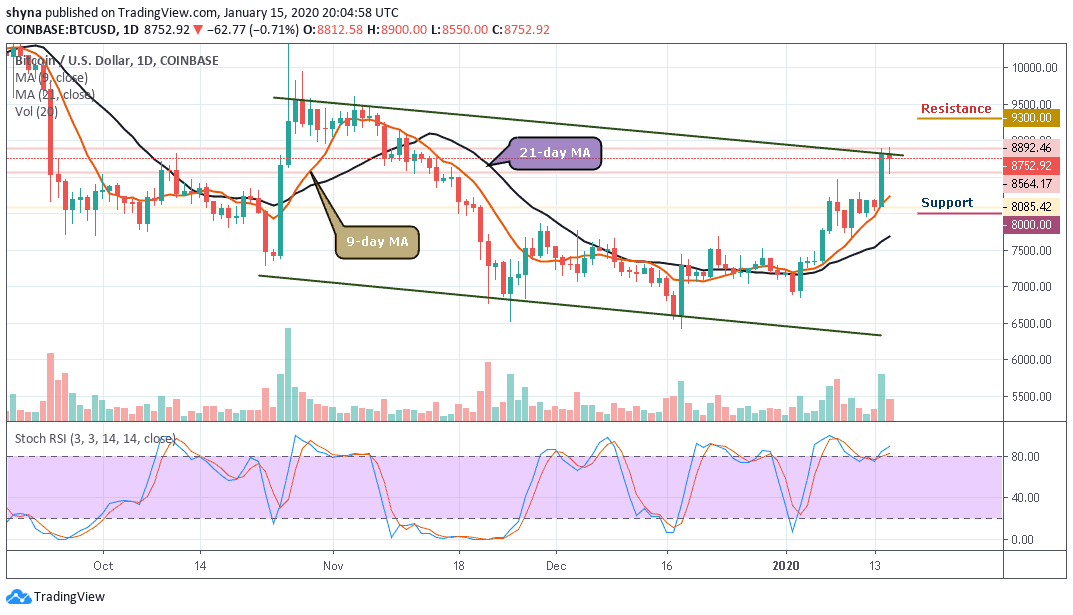
BTC/USD went crazily bullish for almost two days this week. The surge saw the price of Bitcoin rise to levels not reached since last November. For now, BTC/USD is dancing at $8,746.66 after losing 0.78% of its value today. More so, where Bitcoin will go next after the impressive rally this week is likely to depend on the ability of the bulls to hold the price above the key support at $8,400.
Nevertheless, a further retracement seems imminent and it is likely to break below $8,500. Meanwhile, looking at the chart, $8,500, $8,000 and $7,500 serve as the major support levels, making room for BTC to fall even further. The stochastic RSI for the coin is still within the oversold territory, suggesting more bullish movements as the 9-day MA signal line is above the 21-day MA.
However, as the daily chart reveals, if the bulls could put more effort and push the price above the upper boundary of the channel, BTC/USD may see resistance level at $9,000, any further movement could send it to the potential resistance levels of $9,300, $9,500 and $9,700 respectively as the technical levels remain positive.
BTC/USD Medium-Term Trend: Bullish (4H Chart)
Looking at the 4-hour chart, the bears wanted to step back into the market by bringing the price from $8,820 to $8,608, but the bulls quickly held the support by picking the price from there to where it is currently trading at $8,810 which is above the 9-day moving average. Meanwhile, the $9,600 and above may come into play if BTC/USD breaks above the channel.
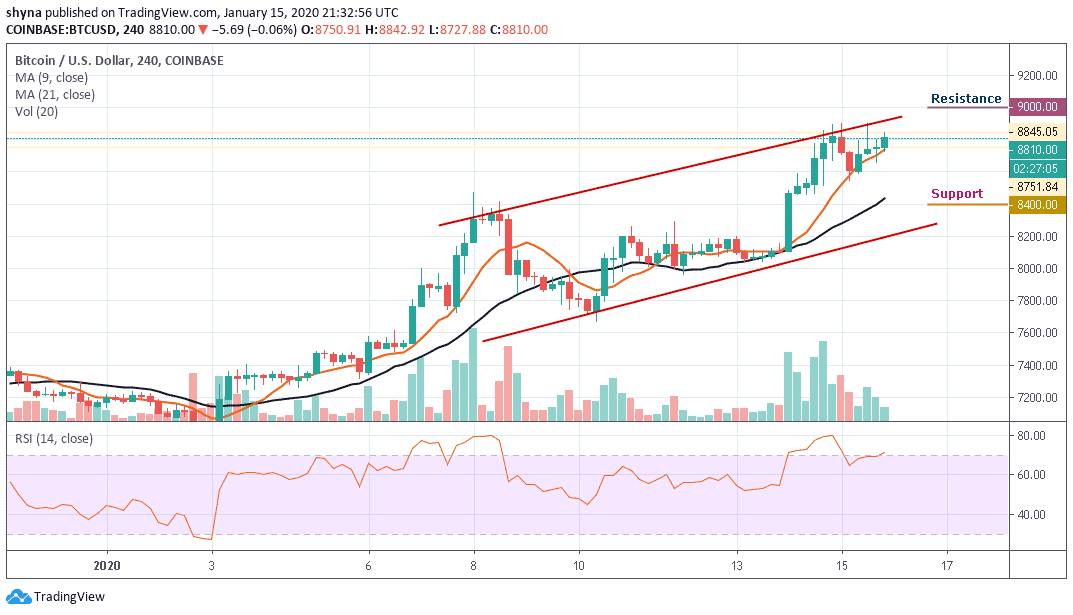
However, if the price breaks below the 9-day moving average of the ascending channel and begins to fall, the support levels of $8,400 and below may be in focus. Meanwhile, as the RSI (14) moves into the overbought zone, more bullish signals may play out before a reversal could come in.
Please note: Insidebitcoins.com is not a financial advisor. Do your research before investing your funds in any financial asset or presented product or event. We are not responsible for your investing results.
Join Our Telegram channel to stay up to date on breaking news coverage