Join Our Telegram channel to stay up to date on breaking news coverage
Bitcoin (BTC) Price Prediction – August 11, 2020
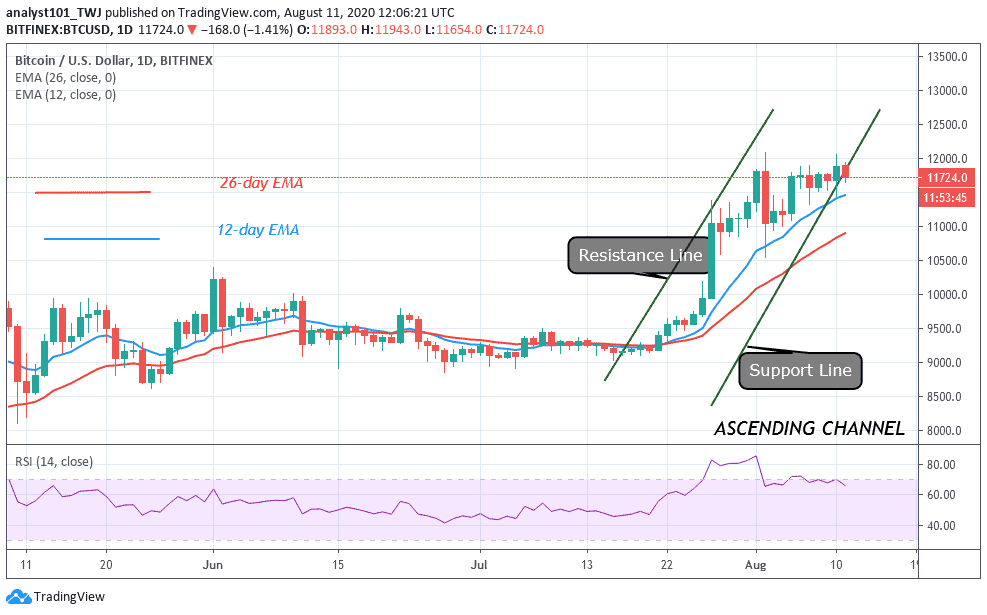
Today, BTC/USD has been on a downward move after partially breaking the $12,000 overhead resistance. In early August, buyers broke the overhead resistance twice. On August 2, BTC reached a high of $12,097 but fell to $10.548 low. Yesterday, the king coin reached a high of $12,065 but was repelled; the market is still on a downward move.
Resistance Levels: $10,000, $11, 000, $12,000
Support Levels: $7,000, $6,000, $5,000

Bitcoin bulls failed to break the overhead resistance because sellers are in strong defense of the resistance. Bitcoin has continued to retrace in the last 24 hours. If the selling pressure is strong the downward move will persist. However, buyers must sustain the price above the $11,000 support. On the downside, if price breaks and closes below $11,000 support, Bitcoin will be showing signs of weakness.
And the market will drop to $10,400 support. That was the support zone where the coin fell on August 2 before price correction. Buyers will like to defend this level for the resumption of the upside range trading. It is very unlikely if the bears will break below $10,400. This will be an invitation for the bears to take control of the price. Meanwhile, BTC will rise as it is at level 65 of the Relative Strength Index period 14. The king coin is trading in the bullish trend zone and it above the centerline 50.
Band Protocol (Band) and Chainlink (LINK) Outperform Bitcoin in 10 Days
Since early August, the above altcoins have outperformed Bitcoin. BAND traded from $3.19 to as high as $17.78. On the other hand, LINK was surging from $7.60 to $14.45 as of August 10. This came at a time when Bitcoin is still struggling to break the $12,000 overhead resistance. The two altcoins are successful because of the growth of the Decentralized Finance (Defi) sector. Each of these altcoins is operating as an oracle blockchain network that supplies data to Decentralized Finance ( Defi) applications.

BTC/USD Next Possible Direction
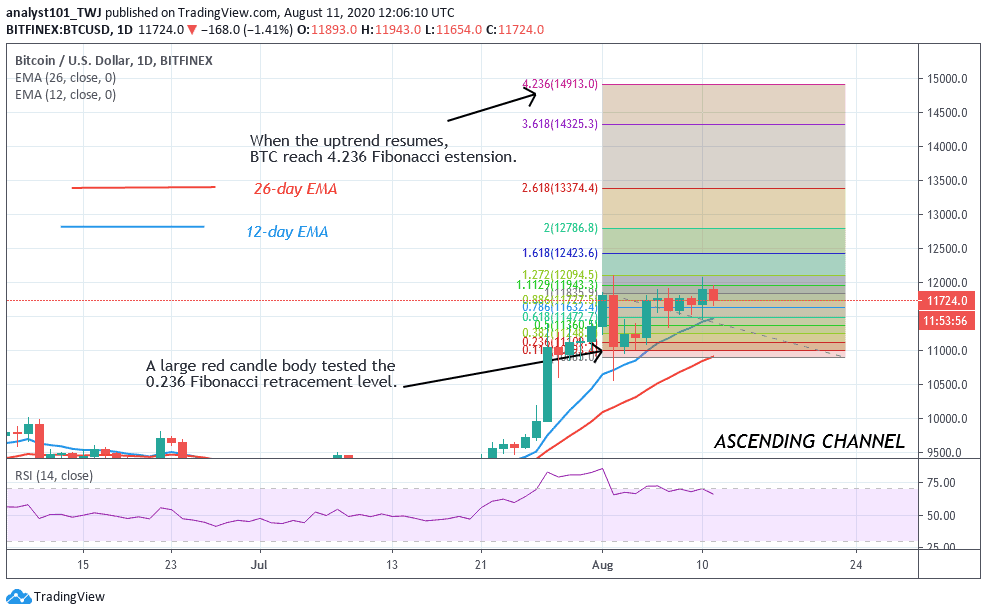
Bitcoin uptrend is still intact despite the recent downtrend. The current support at $11,700 is likely to hold and BTC will rise. In the recent uptrend on August 1, the red candle body tested the 0.236 Fibonacci retracement level. This explains that when the uptrend resumes BTC will reach the 4.236 Fibonacci extension level which is the $15,000 high.
Join Our Telegram channel to stay up to date on breaking news coverage

