Join Our Telegram channel to stay up to date on breaking news coverage
Bitcoin Price Prediction – February 24
The Bitcoin price prediction shows BTC recovering the downside as the cryptocurrency rebounds after touching the $34,322 low.
BTC/USD Long-term Trend: Bearish (Daily Chart)
Key levels:
Resistance Levels: $40,000, $38,000, $36,000
Support Levels: $32,000, $30,000, $28,000

BTC/USD is trading with another loss of 2.30% today as the cryptocurrency falls beneath the $36,411 support level to reach the daily low at $34,322. However, the daily chart reveals that $34,000 is a very important area as it is expected to provide strong support for the coin.
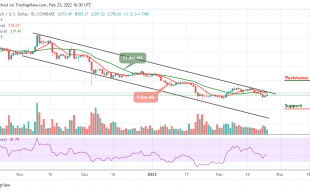
Bitcoin Price Prediction: Bitcoin Price May Cross Below $34k
The Bitcoin price continues to slide below the 9-day and 21-day moving averages at support provided by the trend line of the channel. A breakdown towards the lower boundary of the channel could cause the Bitcoin price to create a new low below the $33,000 level. A drop below the lower boundary of the channel could be detrimental to Bitcoin as it could lead the first digital asset towards the supports at $32,000, $30,000, and $28,000.
Moreover, if the buyers can rebound, the first level of resistance could lie at $37,000. Above this, further resistance is expected at $39,000. This may likely follow by the potential resistance at $40,000, $42,000, and $44,000 levels. Therefore, if the coin can break above these levels, then the market may be on the verge of turning bullish in the long term. Now, the Relative Strength Index (14) remains below 40-level, indicating that more bearish signals might come to play.
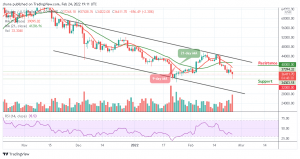
BTC/USD Medium-Term Trend: Bearish (4H Chart)
As revealed by the 4-hour chart, the Bitcoin price is seen hovering at $38,557 as the coin crosses above the 9-day and 21-day moving averages heading to the upper boundary of the channel. However, if the bulls decide to keep the price at the upside, the coin may likely hit the resistance at $42,000 and above.
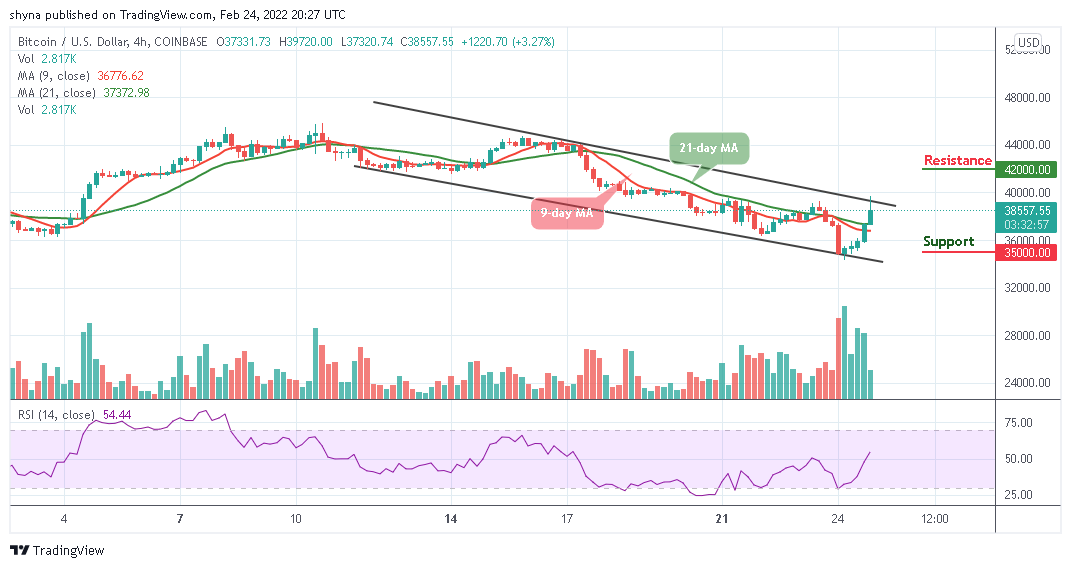
However, it now appears that the cryptocurrency is at risk of seeing further downside in the near term, as the 9-day MA remains below the 21-day MA. Therefore, the Relative Strength Index (14) is crossing above 60-level to more bullish signals but any bearish movement below the moving averages may locate the support at $35,000 and below.
Looking to buy or trade Bitcoin (BTC) now? Invest at eToro!
68% of retail investor accounts lose money when trading CFDs with this provider
Read more:
- How to buy Bitcoin
- How to buy Cryptocurrency
Join Our Telegram channel to stay up to date on breaking news coverage