Join Our Telegram channel to stay up to date on breaking news coverage
Bitcoin Cash Price Prediction – February 23
The Bitcoin Cash price is recovering from the daily low of $289 level as the price remains within the short-term bullish trend.
BCH/USD Market
Key Levels:
Resistance levels: $400, $420, $440
Support levels: $200, $180, $160
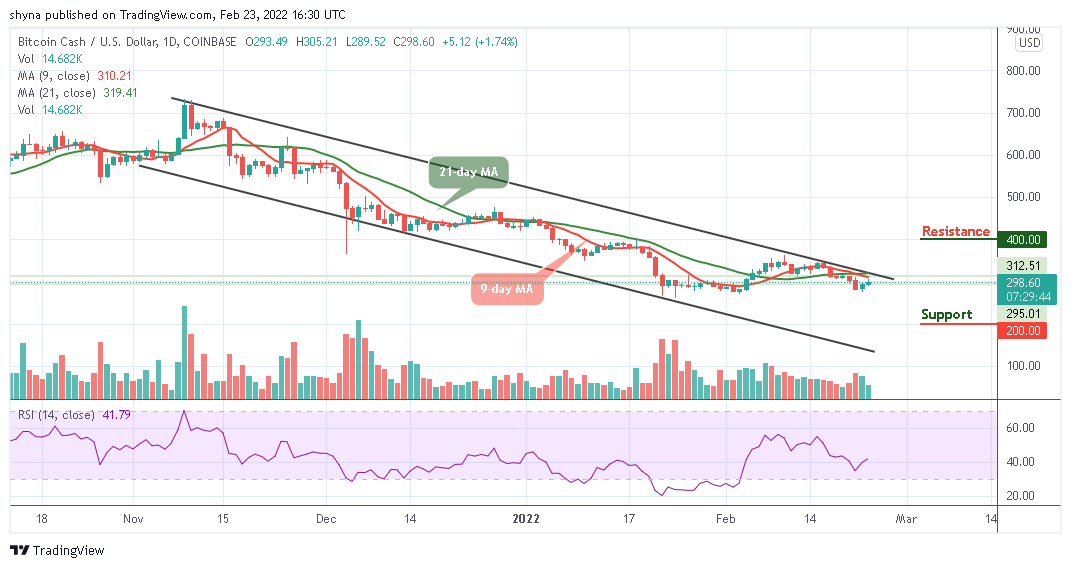
BCH/USD is trading towards the 9-day and 21-day moving averages after touching the daily low at $289 level. At the time of writing, the Bitcoin Cash is changing hands at $300, having gained over 2.45% since the beginning of the European session. However, with latest the recovery, the coin is likely to cross above the upper boundary of the channel and move into the positive zone.
Bitcoin Cash Price Prediction: Would BCH Stay Above $300?
The Bitcoin Cash price is currently forming a bullish movement as the bulls push the price to touch the 9-day and 21-day moving averages. However, if the bulls maintain the upward trend, BCH/USD may likely cross above the upper boundary of the channel to touch the resistance levels of $400, $420, and $440. In other words, any strong selling pressure may drag the price towards the lower boundary of the channel if the bears step back into the market.
However, should in case Bitcoin Cash stay below the moving averages, the bears could bring the price to the supports of $200, $180, and $160. Meanwhile, the technical indicator Relative Strength Index (14) is seen moving to cross above 40-level, indicating a possible bullish movement.
When compared with Bitcoin, the Bitcoin Cash price keeps moving sideways but the current market movement may follow an uptrend if the buyers push the price above the 9-day and 21-day moving averages to face the upper boundary of the channel.
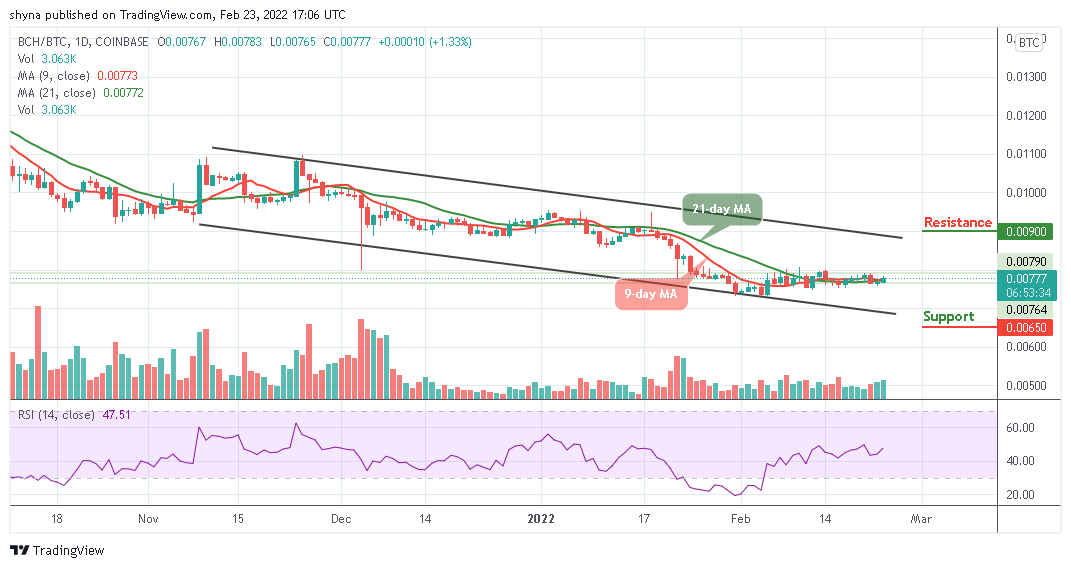
Moreover, as the technical indicator Relative Strength Index (14) moves toward 50-level, once it moves above this level, the market price may resume an upward trend which could hit the resistance level of 900 SAT and above. Meanwhile, a retest below the moving averages could lower the price to the support level of 650 SAT and below.
Looking to buy or trade Bitcoin Cash (BCH) now? Invest at eToro!
68% of retail investor accounts lose money when trading CFDs with this provider
Read more:
- How to buy Bitcoin Cash
- How to buy Cryptocurrency
Join Our Telegram channel to stay up to date on breaking news coverage