Join Our Telegram channel to stay up to date on breaking news coverage
Bitcoin (BTC) Price Prediction – November 4
Bitcoin price is trading nicely above the $9,000 and the coin must climb above the $9,500 resistance to continue higher.
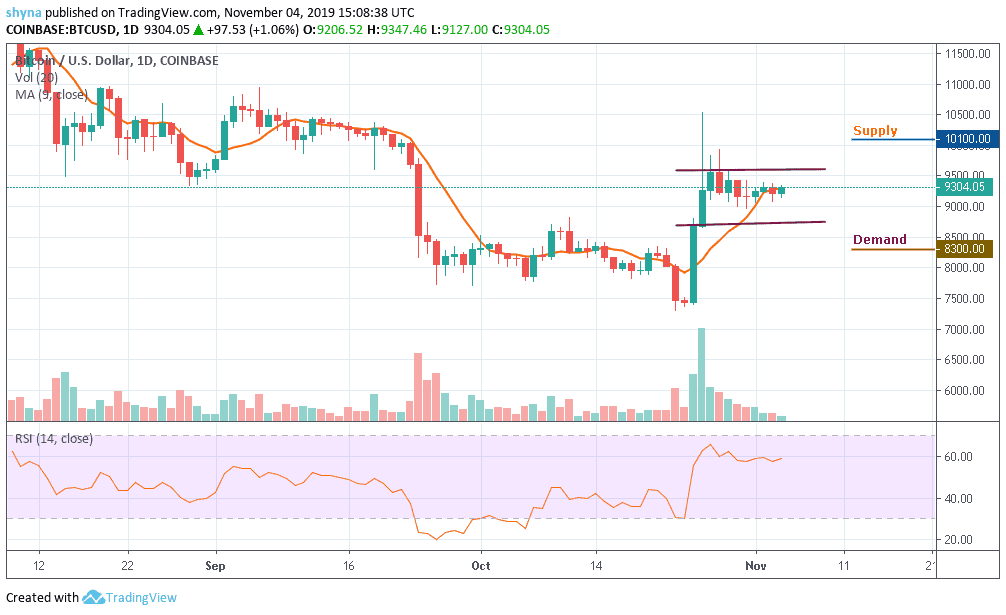
BTC/USD Long-term Trend: Ranging (Daily Chart)
Key levels:
Supply Levels: $10,100, $10,300, $10,500
Demand Levels: $8,300, $8,100, $7,900
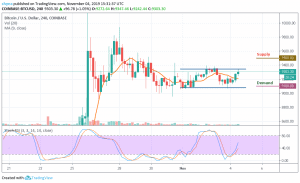
Bitcoin price started the day with a downside movement. Later, the market started improving, although many coins started moving downwards as well. BTC/USD price also reflected a similar movement as the coin improve in price movement at the moment. Within the first few days of the second month of the last quarter, BTC/USD has moved up from $8,900 to $9,100 and now $9,200.
More so, BTC/USD is struggling to climb higher above the $9,300 and $9,400 resistances as the pair is settling in a tight range between $9,000 and $9,300 around the 9-day moving average. In addition, the weekend session that just ended saw Bitcoin and other major cryptos exchanged on a sour tone. Ethereum and Ripple are also trading in the range above $178 and $0.285 respectively.
Moreover, if the market decides to go down, Bitcoin’s price may drop to $8,700 and should this demand fails to contain sell-off, we may see a further drop to $8,300, $8,100 and potentially $7,900. The supply levels to watch are $10,100, $10,300 and $10,500 respectively. Meanwhile, RSI (14) has continued to trend in the same direction since October 30 with an indication of indecisive in the market.
BTC/USD Medium-Term Trend: Ranging (4H Chart)
Looking at the chart, BTC/USD is clearly facing a lot of supplies near the $9,300 and $9,400 level. A successful close above the $9,400 level is a must for bullish acceleration. If not, there is a risk of a downside extension below the $9,200 demand. If there is a downward move, initial demand is near the $9,100 level and the main demand is near the $8,900 level, below which there is a risk of another decline towards $8,700.
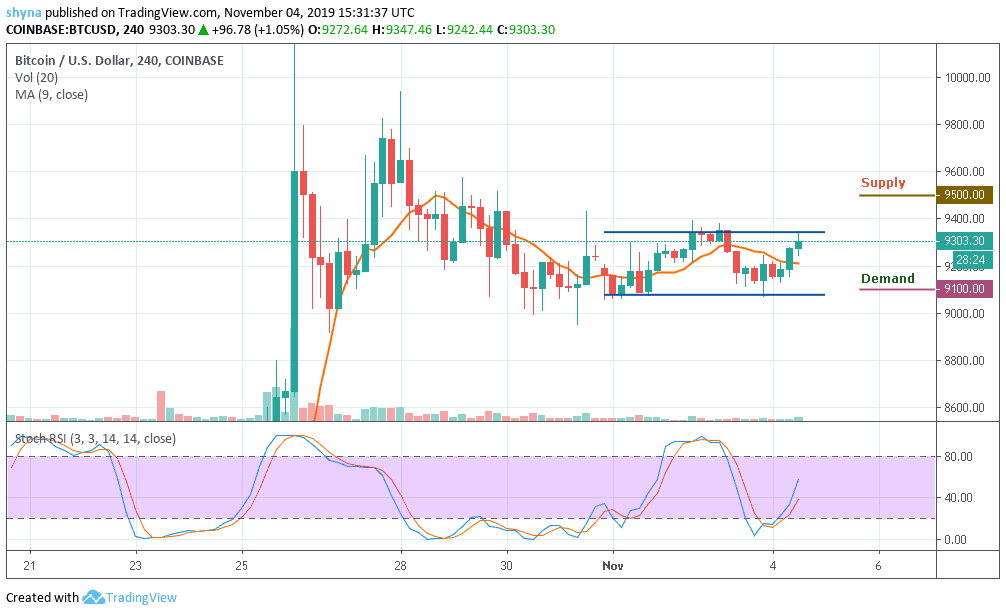
Furthermore, if there are more gains, the $9,300 level is likely to act as a major hurdle in the near term for Bitcoin. So if there is an upside break above the $9,300 supply, the next stop for the bulls may perhaps be near the $9,400, $9,600 and $9,800 supply levels as the stochastic RSI moves above 40-level, which indicates that a bullish trend may come into play.
Please note: Insidebitcoins.com is not a financial advisor. Do your research before investing your funds in any financial asset or presented product or event. We are not responsible for your investing results.
Join Our Telegram channel to stay up to date on breaking news coverage