Join Our Telegram channel to stay up to date on breaking news coverage
Bitcoin (BTC) Price Prediction – January 17
BTC/USD breaks the $9,000 resistance but fails to sustain the gains. Meanwhile, a reversal could be necessary for the coin to create fresh interest from the bulls.
BTC/USD Long-term Trend: Bullish (Daily Chart)
Key levels:
Resistance Levels: $9,500, $9,700, $9,900
Support Levels: $8,000, $7,800, $7,600
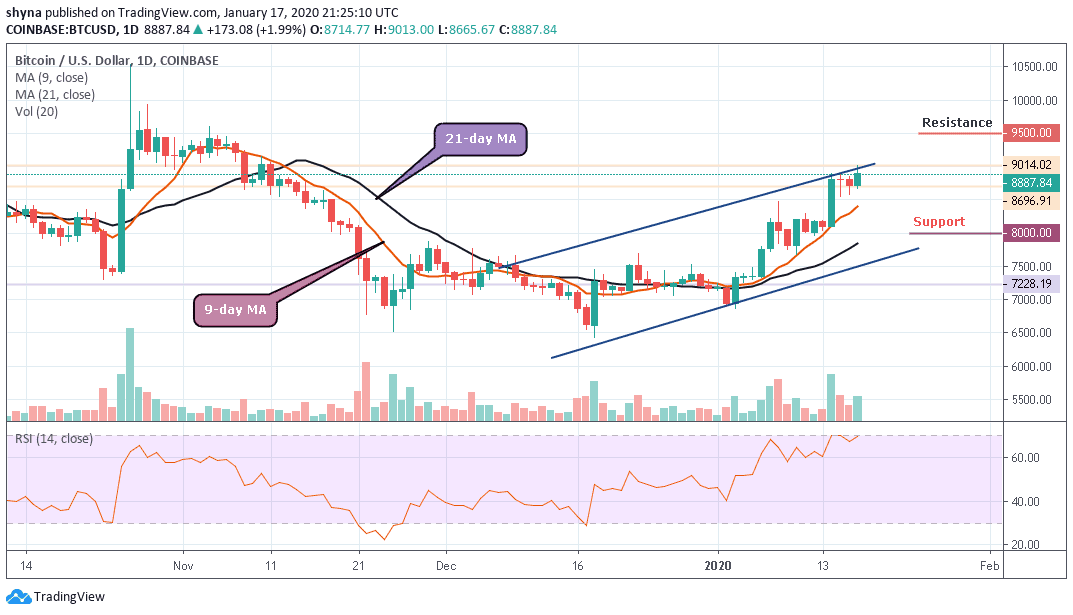
BTC/USD started the year at around $7,228 and now trades at $9,014 as at the time that the market opens today, charting notable increases throughout the entire week. In the past 24 hours alone, the coin has gained another 1.99% to its value, increasing from around $8,696 to about $9,014 from where it retraced a bit and currently trading above the 9-day and 21-day moving averages at $8,887.
Unfortunately, the gains were unsustainable, and Bitcoin succumbed to the pressure. But an extended reversal appears to be imminent, especially with the RSI (14) retreating after touching the level at 70. Bitcoin is currently erasing accrued gains after the price touched $9,014 level. In addition to that, the way the technical indicator is moving reveals that a reversal is underway, although it might not come immediately.
Meanwhile, looking at the daily chart, $8,000, $7,800 and $7,600 still serves as the major support levels. However, if the bulls could put more effort and push the price above the upper boundary of the channel, BTC/USD may see resistance level at $9,200; any further movement could send it to the potential resistance levels of $9,500, $9,700 and $9,900 respectively.
BTC/USD Medium-Term Trend: Bullish (4H Chart)
Looking at the 4-hour chart, Bitcoin’s price is currently trading around $8,906 and above the 9-day and 21-day moving averages after a reversal from $8,838 that occurred in a couple of days ago. Meanwhile, we can see that the bullish supply is becoming heavy in the market while the bears are also trying to bring the price down.
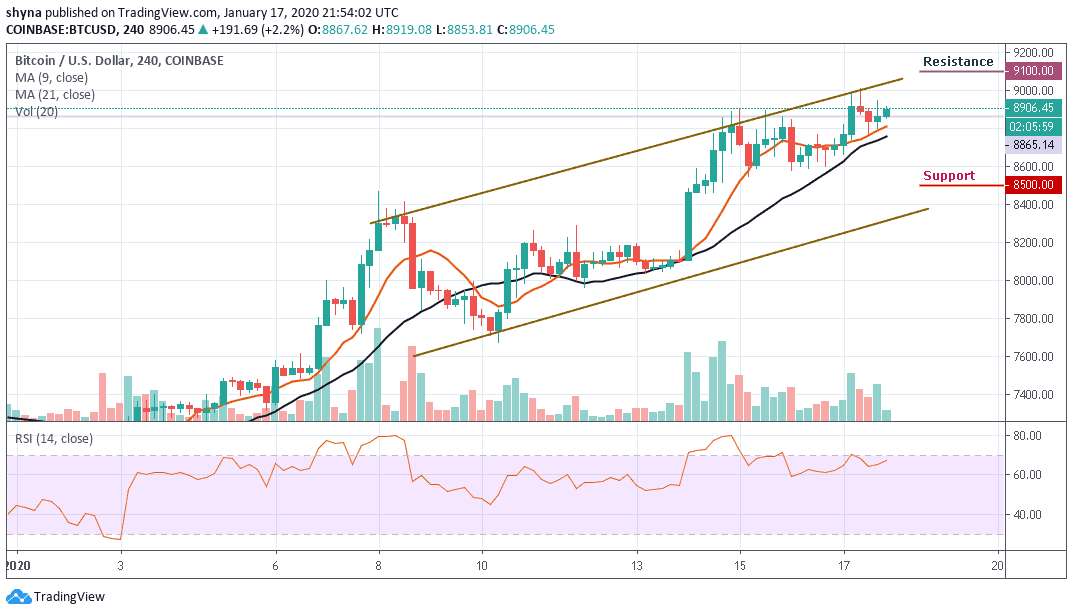
Furthermore, if the buyers could strengthen and energize the market more, they can further push the price to a $9,000 resistance level. Therefore, breaking the mentioned resistance may likely allow the bulls to test the $9,100 and above. In other words, the RSI (14) is currently moving around 67-level, but when it turns down; the bears could step back into the market and bring the price to the support level of $8,500 and below.
Please note: Insidebitcoins.com is not a financial advisor. Do your research before investing your funds in any financial asset or presented product or event. We are not responsible for your investing results.
Join Our Telegram channel to stay up to date on breaking news coverage