

Join Our Telegram channel to stay up to date on breaking news coverage
Bitcoin (BTC) Price Prediction – June 20
The Bitcoin bulls are running out of options and it is either they break above $9,270 or risk plunging under $9,300.
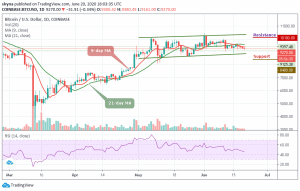
BTC/USD Long-term Trend: Ranging (Daily Chart)
Key levels:
Resistance Levels: $10,100, $10,300, $10,500
Support Levels: $8,400, $8,200, $8,000

Today, after weeks of indecision and ping-ponging between a tightening range, BTC/USD finally appears to have made a decision on its direction in the short term and has fallen below the support of $9,300. After some weeks of consolidation, BTC/USD has run out of steam and now begun to fall slightly. The crypto asset is currently trading below the moving averages of 9-day and 21-day and breaking the support level of $9,000.
Meanwhile, the daily chart reveals that the Bitcoin price is declining rapidly and the coin is trading close to the critical support of $9,200, which is down of 0.34% since the beginning of the day. More so, the downside momentum has been gaining traction after the price moves below the 9-day MA on the daily chart. The psychological $9,000 is under threat now and once it is out of the way, the sell-off may be extended towards the support levels of $8,400, $8,200, and $8,000 respectively.
On the daily chart, the bulls will need to see a sustainable move above the moving averages to mitigate the initial bearish pressure. Should in case the coin manages to recover above this handle, then the upside momentum may gain traction and could take BTC/USD to $10,100, $10,300, and $10,500 resistance levels. The technical picture looks bearish as RSI (14) faces level 40 pointing downwards, which indicates that the sell-off may continue.
BTC/USD Medium-Term Trend: Bearish (4H Chart)
After the crypto faced a long period of consolidation within its previously established trading range, Bitcoin bears are now coming up slowly into the market and this may push the BTC price below its previous support level. Although, the Bitcoin price has not yet slipped below $9,000 and it’s still in the loop of making a bounce back. Its price hovers around $9,314 and may take time to persistently trade above $9,500.
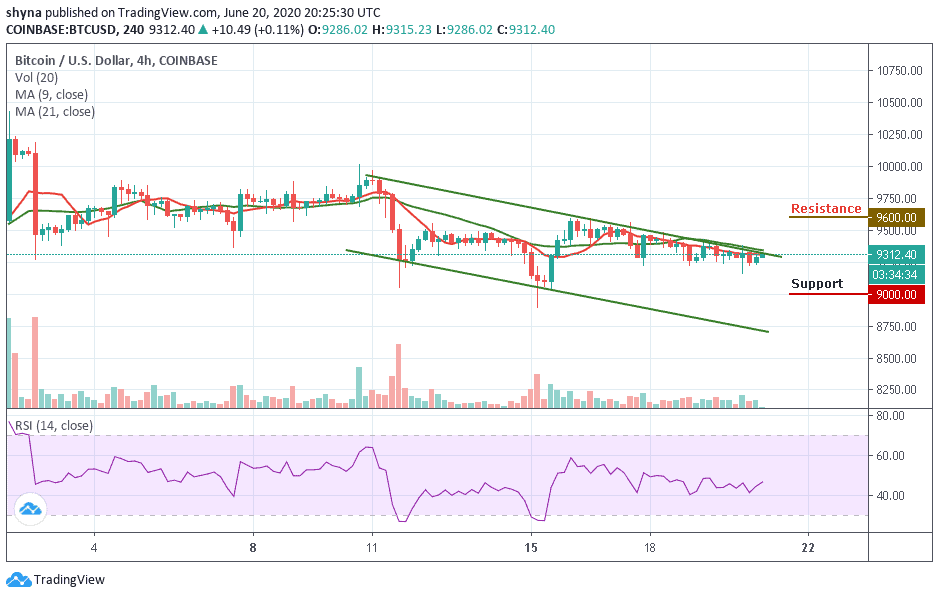
At the moment, BTC/USD is currently moving below the 9-day and 21-day MAs, and the upward movement may likely push the price near the resistance level of $9,600 and above while the immediate support lies at $9,000 and below. The RSI (14) is moving zigzag above the 40-level.
Join Our Telegram channel to stay up to date on breaking news coverage
