Join Our Telegram channel to stay up to date on breaking news coverage
Bitcoin Price Prediction – April 19
There has been no stable reversal moving mode in the BTC/USD market valuation while price moved southward past the lower bullish channel-line around the level of $55,000.
BTC/USD Market
Key Levels:
Resistance levels: $60,000, $65,000, $70,000,
Support levels: $50,000, $45,000, $40,000
BTC/USD – Daily Chart
The BTC/USD bullish channels are yet kept intact. Even though, price had once broken it briefly to the south during yesterday’s session. The lower bullish channel-line has placed support underneath the 14-day SMA trend-line to indicate a normal zone marking the end of most of the downward moves since the start of this market’s bullish trend. The 50-day SMA indicator is pointing towards the north near below the $50,000. The Stochastic Oscillators have slantingly expanded their mode of slanting-posture from the overbought region to range 20. But, they look like attempting to make a cross-back to suggest a start of price rallying in the near time.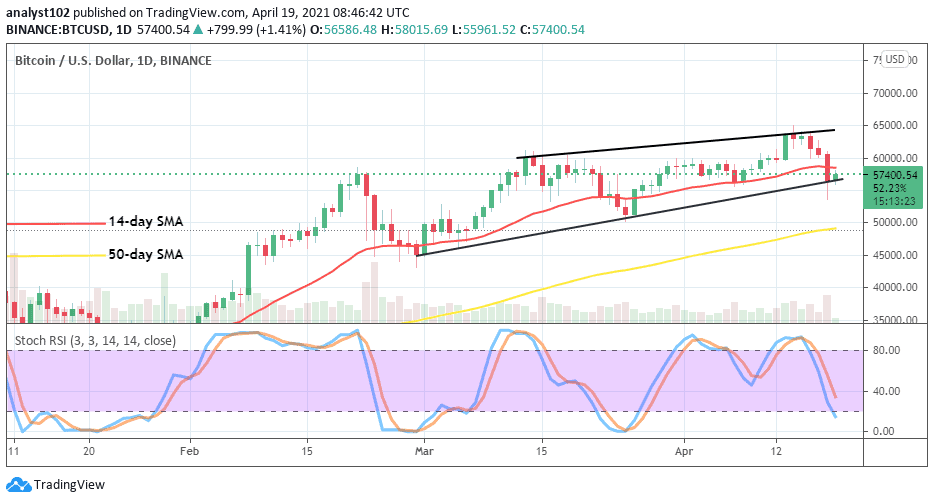
Will the BTC/USD market keep on with its bullish channel lines?
The occurrence of the recent bearish move seems necessary as the market is having it presently. The technical trading approach has it that it could be the best zone in achieving that the BTC/USD bulls beef up the energy to stage a come-back around the current trading area of $55,000. It may only take a while as there has been a sign of price relaxing in its move in the crypto-trade.
A forceful breakdown of the lower channel-line is most needed to suggest a possible return of bearish stance launching its full-fledged pushes against the crypto’s value. However, in the event of that assumption playing out, the support level of $50,000 will be at a first instance difficult to keep a dip safely for a long time. A test or a touch of it will most likely set the market on a visible rallying move.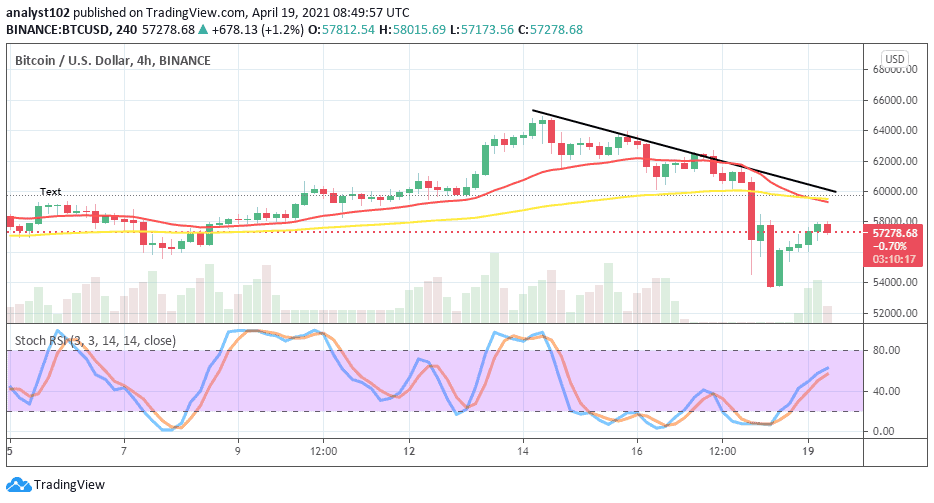
BTC/USD 4-hour Chart
The BTC/USD market valuation is now struggling for recovery from a recent sudden downward pressure it suffers. The medium-term chart still indicates that the crypto has not been able to push out of pressures as all the trading indicators are located over the current price. The 50-day SMA trend-line has been touched by the 14-day SMA from the top in an attempt to intercept to the south. The Stochastic Oscillators have slantingly placed northwardly from the oversold region to range 60. That indicates that the crypto is mustering energy in a recovery-moving manner. Therefore, it may take a while before a full picture of recovery finally takes a centre stage.
Join Our Telegram channel to stay up to date on breaking news coverage