Join Our Telegram channel to stay up to date on breaking news coverage
Bitcoin (BTC) Price Prediction – March 28
After accumulating above $6,500, the Bitcoin (BTC) experienced the most anticipated fall as it retests around $6,000 and $6,100 respectively.
BTC/USD Long-term Trend: Bullish (Daily Chart)
Key levels:
Resistance Levels: $7,600, $7,800, $8,000
Support Levels: $5,000, $4,800, $4,600
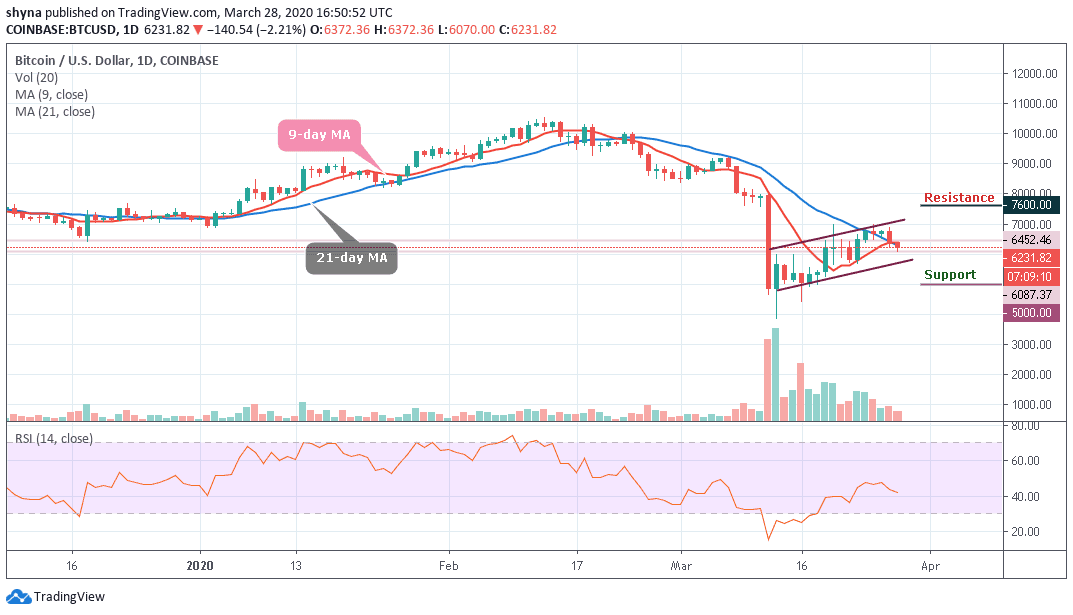
For the past eight days, the leading cryptocurrency, BTC/USD has dropped to nearly $6,080 after trading in the $5,800 to $6,900 range. The coin has been trading within an ascending price channel since the March collapse but is in danger of dropping beneath as the selling momentum increases. The technical indicator RSI (14) failed to break above the 50-level which shows that the sellers are still not ready to give up the control of the market momentum just yet.
Today, the Bitcoin price is currently witnessing a drop of 2.21% as the price plunges below $6,100. More so, the drop in the price of Bitcoin indicates that the cryptocurrency may soon be following the downward trend if the price crosses below the 9-day and 21-day moving averages. However, should this bearish movement come to play, Bitcoin (BTC) may likely crash below $5,500 over the weekend.
Nevertheless, if Bitcoin bulls hold the price and move above the 9-day and 21-day moving averages; the price could rise above the channel and move to $7,200 vital resistance. A further high drive could send the coin to $7,600, $7,800 and $8,000 resistance levels. Meanwhile, the RSI (14) signal line has nosedived to the south, which shows a possible bearish momentum and the support levels to watch are $5,000, $4,800 and $4,600 respectively.
BTC/USD Medium-Term Trend: Bearish (4H Chart)
On the 4-hour chart, we can see that the bears have been stepping back into the market, but the bulls are trying to defend the $6,000 support as well. Moreover, the support level of $5,800 and below may come in play if the coin breaks the $6,000 support.
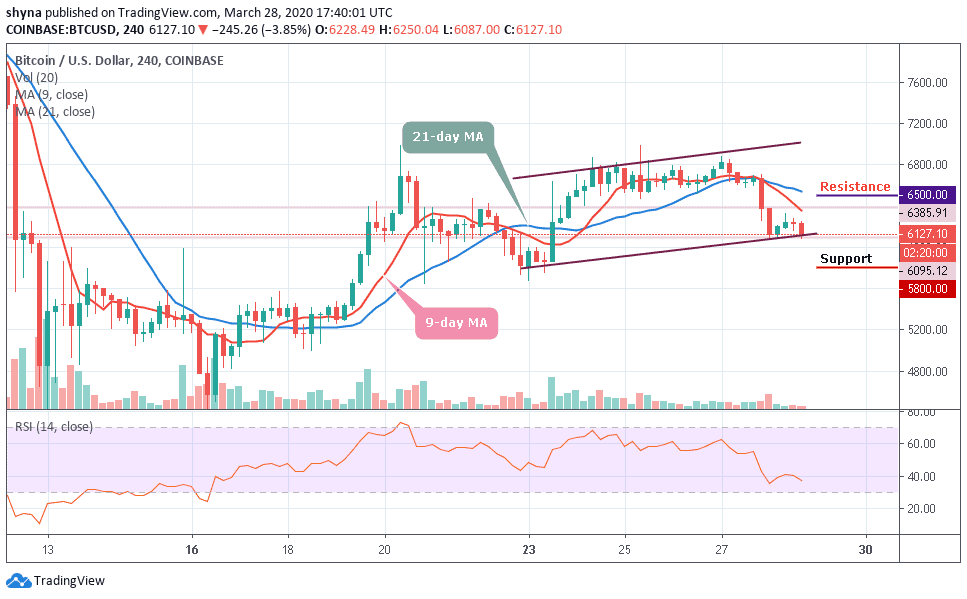
However, in as much as the buyers can reinforce and power the market, we can expect a retest at the $6,385 resistance level. Breaking the mentioned resistance may further allow the bulls to retest the $6,500 and above on the upside but the RSI (14) is still facing the south, which may increase the bearish momentum.
Please note: Insidebitcoins.com is not a financial advisor. Do your research before investing your funds in any financial asset or presented product or event. We are not responsible for your investing results.
Join Our Telegram channel to stay up to date on breaking news coverage