Join Our Telegram channel to stay up to date on breaking news coverage
Bitcoin Price Prediction – March 23
The Bitcoin price prediction shows BTC bulls moving against the USD at numerous levels, which touch the resistance level of $43,000.
BTC/USD Long-term Trend: Ranging (Daily Chart)
Key levels:
Resistance Levels: $48,000, $50,000, $52,000
Support Levels: $36,000, $34,000, $32,000
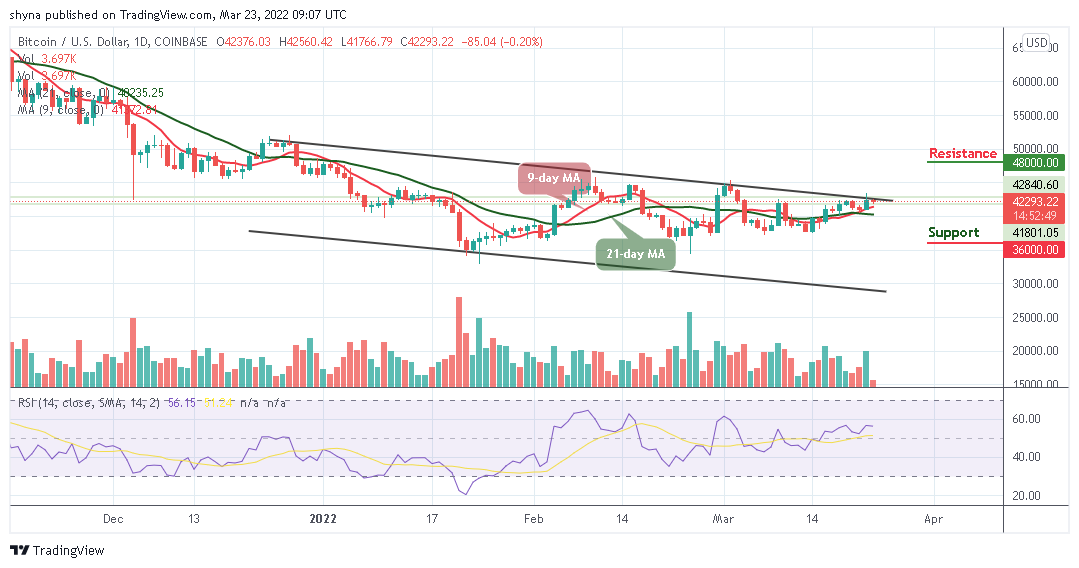
BTC/USD may be resuming its upward movement after touching the daily low of $41,766 during the European session today. Yesterday, the Bitcoin price hit just over $43,000 before closing at $42,378. However, the price of the leading crypto asset is likely to head towards the north by crossing above the upper boundary of the channel.
Bitcoin Price Prediction: BTC Price Struggles at $42,000, What Next?
According to the daily chart, the Bitcoin price is now moving above the crucial levels which may now function as the support zones in the event a reversal occurs. On the upside, as the coin moves and prepares to break above the channel, little is in place to prevent correction targeting the key resistance of $43,000 as the technical indicator Relative Strength Index (14) moves around 56-level.
Nevertheless, BTC/USD is banking on the support at $41,000 to ensure that despite a reversal, the Bitcoin price stays above the $42,000 level. Similarly, the potential resistance levels may be located at $48,000, $50,000, and $52,000 while the support levels can be reached at 36,000, $34,000, and $32,000 respectively.
BTC/USD Medium – Term Trend: Ranging (4H Chart)
The 4-hour chart shows that the Bitcoin price hovers within the 9-day and 21-day moving averages as the Relative Strength Index (14) moves below 60-level. Although bulls have been trying to push the price upward for some time now, the market may likely experience more downtrends if the price cross below the 21-day moving average.
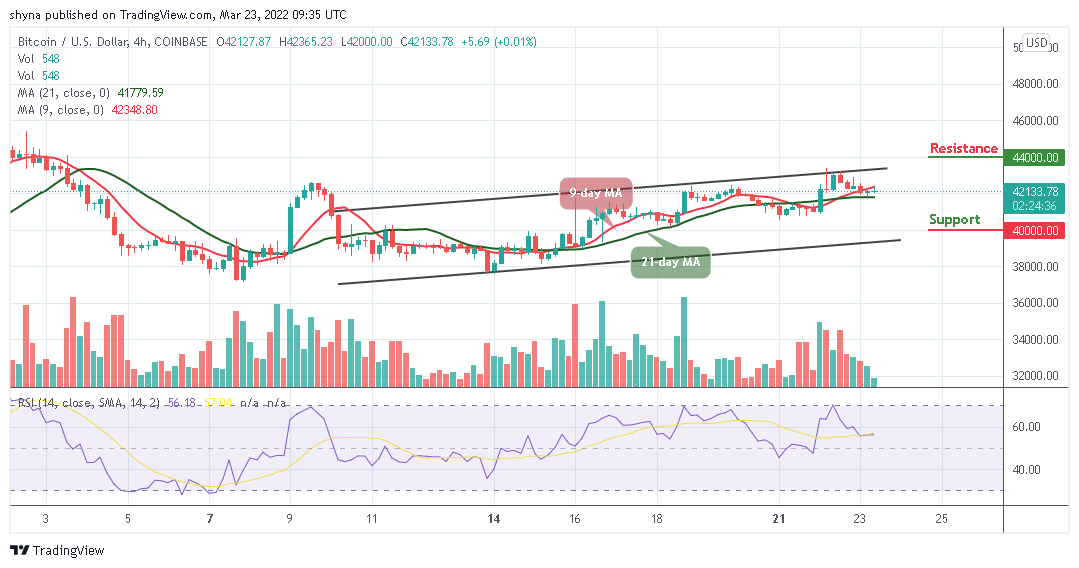
Meanwhile, the support level of $40,000 and below may come into play if the king coin heads towards the lower boundary of the channel. But if the buyers can put more effort; they can push the price to cross the upper boundary of the channel where it could hit the targeted resistance level of $44,000 and above.
Looking to buy or trade Bitcoin (BTC) now? Invest at eToro!
68% of retail investor accounts lose money when trading CFDs with this provider
Read more:
- How to buy Bitcoin
- How to buy Cryptocurrency
Join Our Telegram channel to stay up to date on breaking news coverage