Join Our Telegram channel to stay up to date on breaking news coverage
Bitcoin Price Prediction – February 16
The Bitcoin price prediction shows that BTC keeps trading below the channel as the coin retreats from the $44,195 level.
BTC/USD Long-term Trend: Bearish (Daily Chart)
Key levels:
Resistance Levels: $48,500, $50,500 $52,500
Support Levels: $39,500, $37,500, $36,500
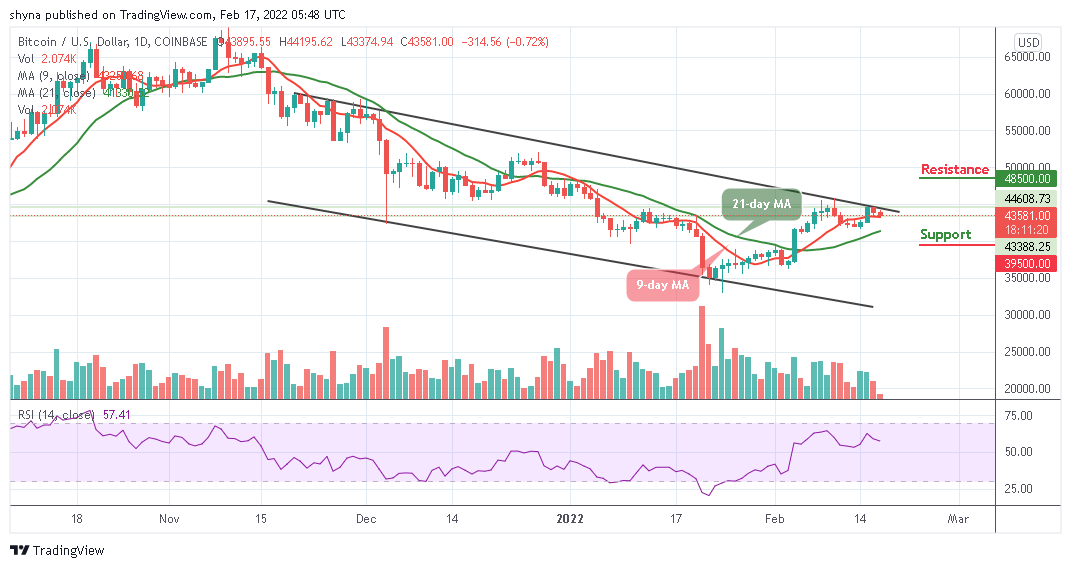
BTC/USD is facing a setback as this may not be a permanent one, and the king coin is likely to have a bearish run in the short term, but a price rally may help the king coin to head to the south if the red line of the 9-day moving average crosses below the green line of the 21-day moving average. Currently, Bitcoin (BTC) is trading around the $43,581 level after touching the daily high at $44,195 during the European session.
Bitcoin Price Prediction: Would Bitcoin (BTC) Cross Below the 9-Day Moving Average?
Looking at the daily chart, the Bitcoin price is likely to cross below the 9-day moving average. However, if the price should slump below the support level of $43,000, the king coin is likely to face a downward trend. Therefore, the further bearish movement could locate the supports at $39,500, $37,500, and $35,500, making room for BTC to fall even further.
In the meantime, the technical indicator Relative Strength Index (14) is likely to cross below 58-level as the trading volume could be in support of the bears. Moreover, if the bulls decide to move the price above the upper boundary of the channel, BTC/USD may locate the resistance levels at $48,500, $50,500, and $52,500 respectively.
BTC/USD Medium-Term Trend: Ranging (4H Chart)
On the 4-Hour chart, the Bitcoin price stays below the 9-day moving average, and the immediate support is likely to come at the $43,500 level. The price may likely fall below this level if the bears fully stepped back into the market.
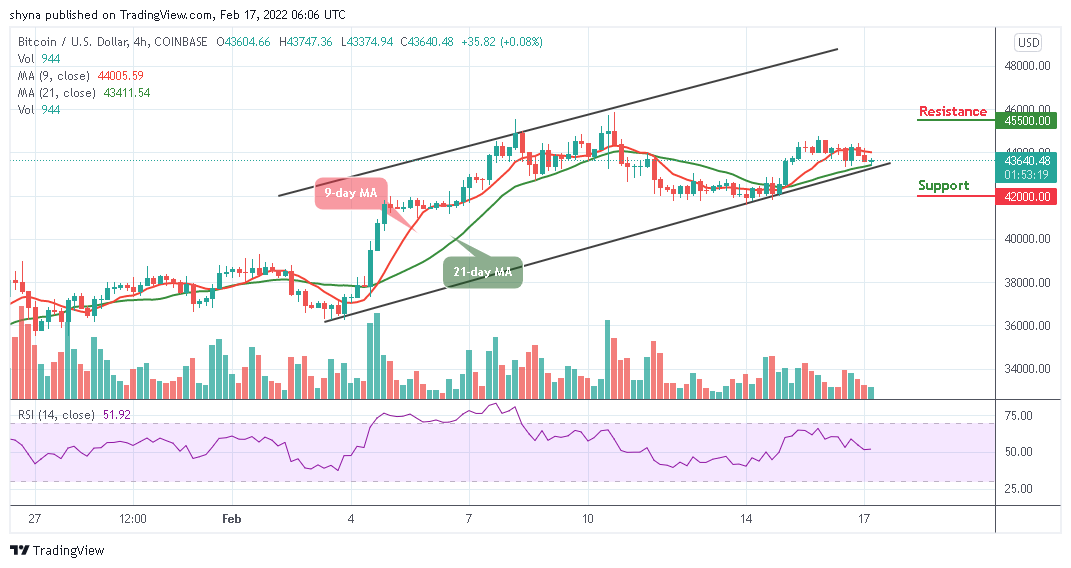
However, a further bearish movement could test the critical support at the $42,000 level and below while the resistance could be located above the 9-day moving average at the resistance level of $45,500 and above. Technically, the Bitcoin price is currently moving into the negative side as the technical indicator Relative Strength Index (14) is likely to cross below 50-level.
(function() { var d=document,w=window;var cS=d.currentScript || (function (){var s = d.getElementsByTagName(‘script’);return s[s.length – 1];})(),i = (function() {var s = cS.previousElementSibling;while (s) {if (s.matches(‘iframe’)) return s;s = s.previousElementSibling;}})(),iW = i.contentWindow,u = parseInt(d.body.getAttribute(‘_iL’) || 0) + 1; i.setAttribute(‘u’, u); i.onload = function() {iW.postMessage({u:u},’*’);}; if (!d.body.getAttribute(‘_iL’)) { w.addEventListener(‘message’, function (e) { if (e.data.hasOwnProperty(“u”)) { var it = d.querySelector(‘iframe[u=”‘+e.data.u+'”]’); if (it) { if (e.data.hasOwnProperty(“h”)) { it.style.height = e.data.h + ‘px’; } else if (e.data.hasOwnProperty(“w”)) { it.style.width = e.data.w + ‘px’; } } } }); } d.body.setAttribute(‘_il’, u); })();
Join Our Telegram channel to stay up to date on breaking news coverage