Join Our Telegram channel to stay up to date on breaking news coverage
Bitcoin Price Prediction – February 14
The BTC/USD market book of records has had it that the crypto-trade now consolidates very near the resistance level of $50,000 after a successful breakout of former $40,000 resistance trading line recently.
BTC/USD Market
Key Levels:
Resistance levels: $50,000, $55,000, $60,000,
Support levels: $40,000, $35,000, $30,000
BTC/USD – Daily Chart
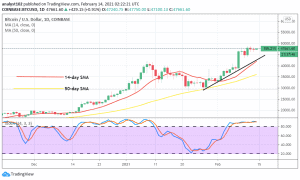
There has been a featuring of bullish candlesticks along the path of the bullish-trend line since the January 28 trading session. On Feb 8, a big bullish candlestick occurred to break out resistance around the value of $40,000. The 50-day SMA trend-line is underneath the 14-day SMA’s. They both point towards the north direction below the current trading zone of the crypto-trade. That shows that bulls are still in control of the market to some extent. Over a couple of transaction days, price levels of between $45,000 and $50,000 have been witnessing series of short-ups and short-downs. The Stochastic Oscillators are dipped into the overbought region to consolidate within it. That also signifies that the BTC/USD bulls are yet not giving any a safe grand to bears’ reliable pressures at this moment of writing.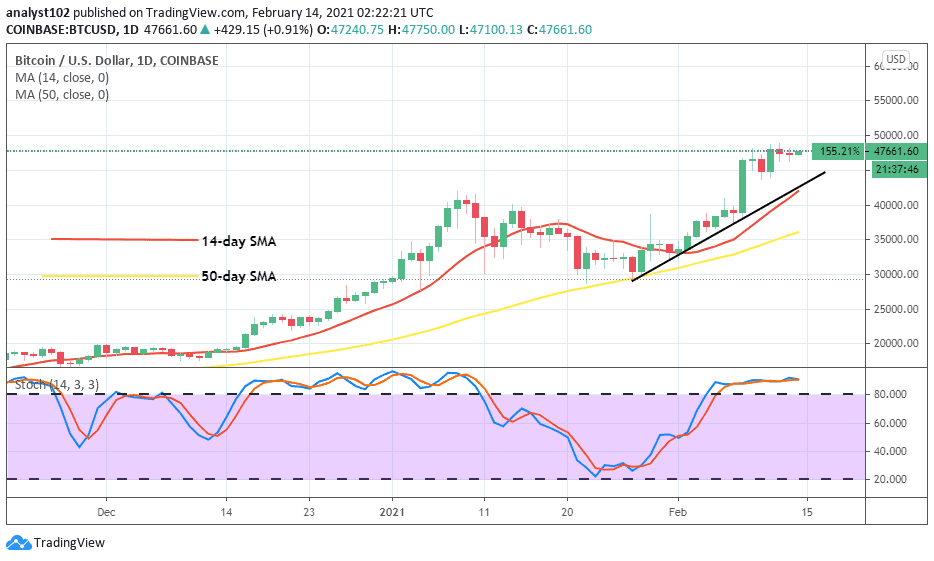
What direction could the BTC/USD market-value move next?
Taking the BTC/USD market’s present trading cycle into consideration, bears’ stands in this crypto-economy are potentially bound to be overwhelmed by bulls’ capacity. Bulls may likely relax their pushing-power efforts to allow other correctional moves around the levels of $45,000 and $40,000 or $35,000 in extension. However, the $45,000 price level is expected to be the support where a spike could occur to give a further clear-cut of the bullish trend continuation moves.
On the downside, a fake breakout of the immediate $50,000 resistance value could cause small sell-offs by traders. But, the most advantage of that may not last beyond support around the $35,000 point in the long run. That said, a volatile price move is necessary to take place before a decent next market direction could obtain. In the meantime, crypto’s price may continue to trade around the $45,000 and $50,000 lines for a while.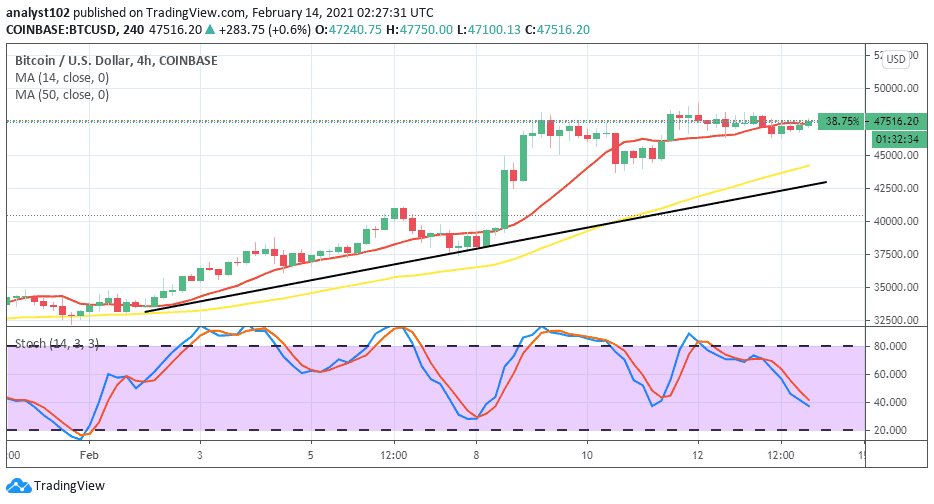
BTC/USD 4-hour Chart
The 4hour-chart shows that there has been a line of lower highs around $45,000 and $47,500 levels after a significant increase in the BTC/USD market-worth from around a low of $37,500 mark. Price has tightly seen trading along with the 14-day SMA’s trend-line. Now, the SMA indicator is a bit bent to the east to suggest an ongoing price consolidation move in the crypto-trade. Both the 50-day SMA trend-line and the bullish-trend-line have placed a bit over the $42,500 level. That point will be serving as the key support line that the BTC/USD bears may be having it difficult to breakdown even if bulls eventually relax pressures to push away northward above $47,500 in a near trading session. The Stochastic Oscillators have slightly bent southward to find a location at range 40. Seemingly, they now attempt to cross the hairs around the range mark. That signals that more ups are potentially in the offing.
Join Our Telegram channel to stay up to date on breaking news coverage