Join Our Telegram channel to stay up to date on breaking news coverage
Bitcoin (BTC) Price Prediction – January 8
Bitcoin is showing first signs of a weakening upside momentum as traders adjust their sentiments near key resistance levels.
BTC/USD Long-term Trend: Bullish (Daily Chart)
Key levels:
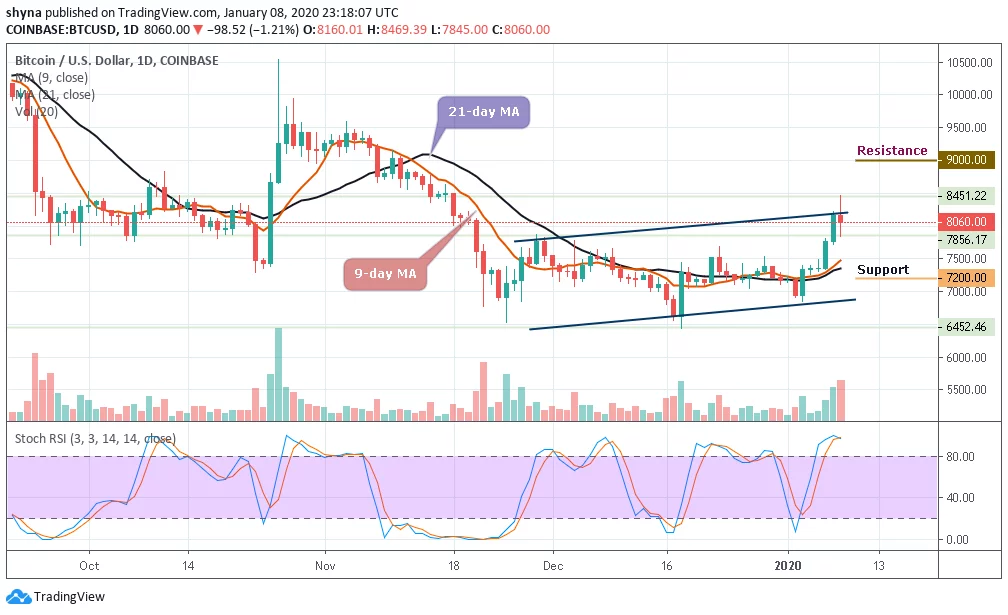
Resistance Levels: $9,000, $9,200, $9,400
Support Levels: $7,200, $7, 000, $6,800
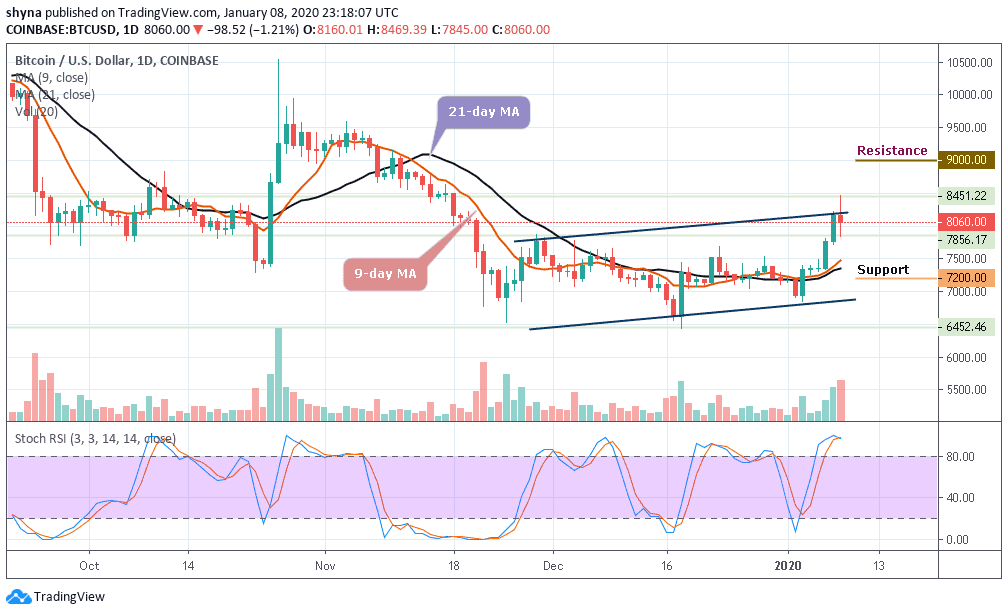
After a jaw-dropping six-day rally that saw BTC/USD rally from last week’s lows of $6,452 to a peak of $8,451 gaining over 23%, momentum finally stalled today, with the leading cryptocurrency retracing so hard. Looking at the daily chart, the price of Bitcoin (BTC) plunged to $7,856, creating a daily low, implying a potential correction back into the $7,500 in the nearest term.
Bitcoin is taking a dive on the intraday charts after hitting a high of 8,451.22 overnight. In addition, the market is deciding around $8,060 above the 9-day and 21-day moving averages, where the buyers are anticipating for a clear breakout. Meanwhile, the $8,500 and $8,700 levels may further surface as critical resistances should the $8,400 level holds. However, a strong bullish spike might take the price to $9,000, $9,200 and $9,400 levels.
Moreover, if the market decides to follow the downward trend, Bitcoin’s price may drop to $7,500 and should this support fails to contain sell-off, we may see a further roll back to $7,200, $7,000 and potentially $6,800. Meanwhile, the stochastic RSI suggests an extremely overbought market and facing down, the market may fall to immediate supports.
BTC/USD Medium – Term Trend: Bullish (4H Chart)
After the crypto faced a long period of upward movement within its previously established trading, Bitcoin bears have now stepped back into the market pushing the BTC price below its previous support level that existed around $7,850. Although the Bitcoin price has not yet slipped below $7,700, it’s still in the loop of making a bounce back. Its price hovers around $8,034.06 and may take time to persistently trade above $8,400.
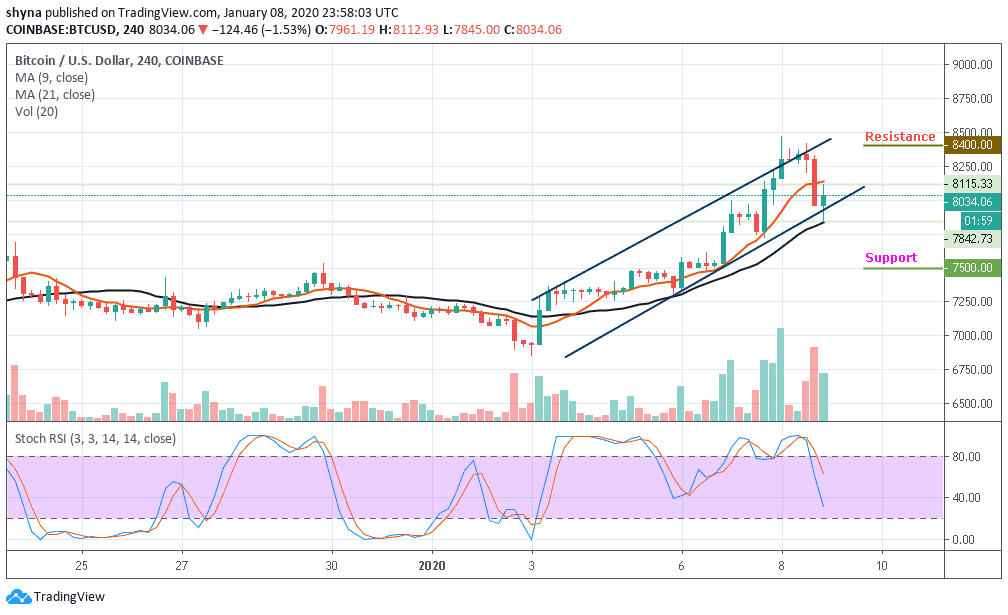
At the moment, BTC/USD is currently moving below the 9-day moving average but still the above 21-day moving average. The upward movement may likely push the price nearest resistance at $8,400, $8,600 and $8,800 resistance levels while the immediate support lies at $7,500, $7,300 and $7,100. The stochastic RSI moves into the oversold zone.
Please note: Insidebitcoins.com is not a financial advisor. Do your research before investing your funds in any financial asset or presented product or event. We are not responsible for your investing results.
Join Our Telegram channel to stay up to date on breaking news coverage