Join Our Telegram channel to stay up to date on breaking news coverage
Bitcoin (BTC) Price Prediction – March 07
Presently, BTC/USD pair has broken its previous range of $8.400 and $8,800. Secondly, it has also broken the resistance at $9,000. At the moment, BTC is battling with the resistance at $9,200.
Key Levels:
Resistance Levels: $10,000, $11, 000, $12,000
Support Levels: $7,000, $6,000, $5,000
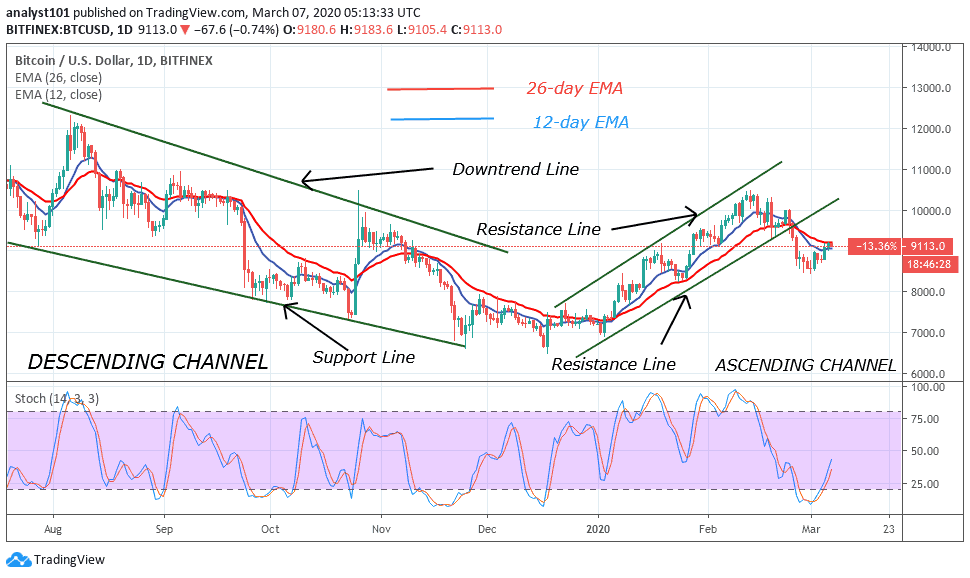
The bulls are emerging from the oversold region as BTC continues its upward move to the previous high. The pair is fluctuating below the résistance at $9,200. On the upside, if the bulls overcome this initial resistance, the upward move to $10,000and $10,500 is very possible.
Buyers are still emerging in the oversold region above 25% range of the daily stochastic. This indicates that Bitcoin is still in bullish momentum. However, the bulls have broken above the 12-day EMA but are yet to break above the 26-day EMA. When price is above the EMAs, the upward movement is guaranteed.
BTC/USD Medium-term Trend: Ranging (4-Hour Chart)
On the 4-hour chart, the bulls are out of the previous price range and they are trading above the 12-day and 26-day EMA. The price is approaching the resistance line to break above it.
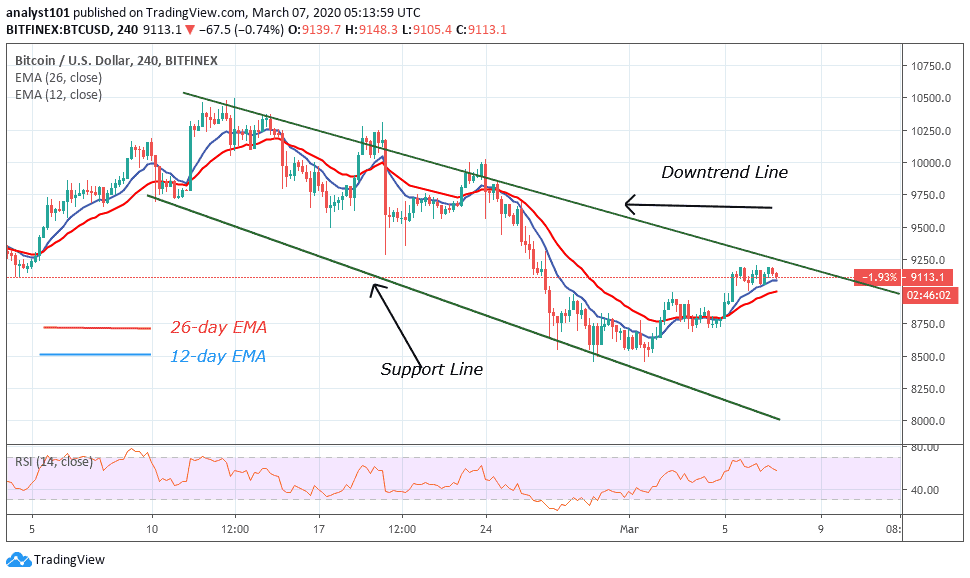
If the resistance line is successfully broken and the price is closed above it, the upward move will continue. Meanwhile, BTC is at level 59 of the Relative Strength Index period 14. It means that the price is in the uptrend zone and it is above the centerline 50.
Please note: Insidebitcoins.com is not a financial advisor. Do your research before investing your funds in any financial asset or presented product or event. We are not responsible for your investing results.
Join Our Telegram channel to stay up to date on breaking news coverage